
Technical analysis often uses the identification of stocks with solid underlying momentum that are also forming consolidation patterns, offering good entry points for breakout trades. This method uses two key metrics: the Technical Rating, which measures the overall condition and trend strength of a stock, and the Setup Quality Rating, which assesses how well the stock is placed for a possible breakout. Stocks with high scores in both areas often present interesting opportunities for technical investors looking to take advantage of continued upward moves.
TALEN ENERGY CORP (NASDAQ:TLN) stands out as a significant candidate based on this method, showing very good technical condition along with a high-quality setup pattern. The company, which operates power infrastructure across the United States with a large presence in nuclear and fossil fuel generation, has shown notable price performance over the last year, gaining over 160% while keeping steady technical quality.
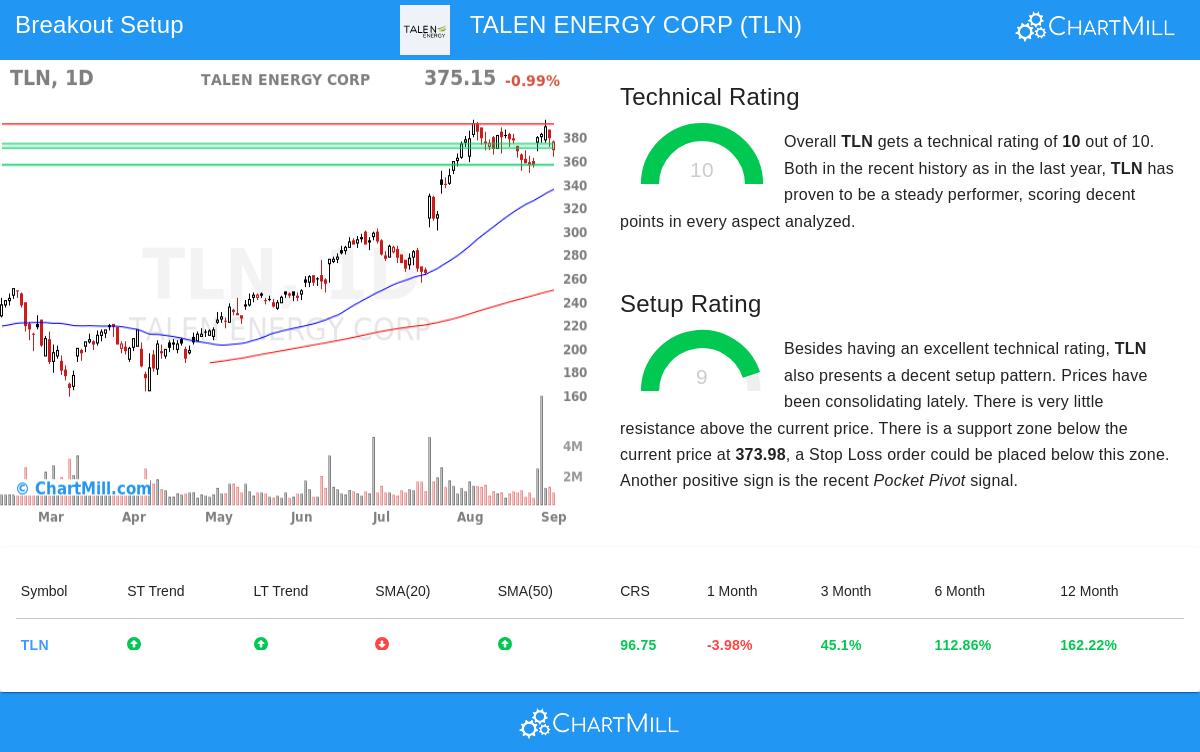
Technical Strength Analysis
The base of any good technical setup starts with a solid trend structure, and TLN does very well here with a perfect Technical Rating of 10. This top score shows very good performance across several technical areas that are important for continued upward movement. The stock keeps positive trends across both short-term and long-term timeframes, showing agreement between immediate momentum and larger directional strength. This dual-trend agreement greatly lowers the chance of false signals and points to institutional accumulation.
Relative strength is especially notable, with TLN doing better than 96% of all stocks in the market over the last year. More significantly, within its industry group of Independent Power and Renewable Electricity Producers, the stock is first among 20 peers, showing sector leadership that often comes before extended outperformance. The stock trades near its 52-week high of $394.25, usually a positive characteristic, though it is important to note the wider market also nears highs, making this performance consistent with rather than exceptional relative to the market.
Multiple moving averages confirm the strength of the trend structure. The stock trades well above its 50-day SMA ($335.01), 100-day SMA ($285.61), and 200-day SMA ($249.02), with all these averages moving upward. This setup creates a layered support structure that has historically offered multiple bounce points during pullbacks. The distance from these moving averages, while large, stays within acceptable limits given the stock's volatility profile.
Setup Quality Examination
While technical strength forms the base, the Setup Quality Rating of 9 shows TLN has created an ideal consolidation pattern before a possible breakout. The stock has been trading between $348.86 and $394.25 over the last month, creating a clear range that allows for straightforward risk management. Currently trading near the middle of this range at $375.15, the pattern points to a balance between buyers and sellers that often ends with a directional move.
The setup shows several beneficial characteristics for breakout traders. Resistance seems limited, with only one major resistance zone found around $390.69, representing a manageable obstacle about 4% above current levels. On the other hand, support seems solid with three separate support zones, the strongest ranging from $370.03 to $373.98 formed by a mix of trendlines and moving averages. This tight support group provides a logical place for protective stop-loss orders.
Volume characteristics further back the quality of the setup. While the 50-day average volume is at 1.3 million shares, recent trading has shown higher activity with the 5-day average reaching 2.5 million shares. This volume increase during consolidation often points to accumulation. Especially important is the recent Pocket Pivot signal, a volume/price pattern that suggests institutional buying happening within the base instead of on clear breakouts, a characteristic often linked to sustained advances.
Risk Management Considerations
The technical analysis suggests a possible entry around $390.70, just above the identified resistance, with a stop-loss around $370.02 below the main support zone. This creates a risk of about 5.3% on the trade, which fits reasonably with the stock's Average True Range of 3.79%. Traders might think about adjusting these levels based on their risk tolerance, particularly given the note that the stop distance seems relatively tight compared to the stock's daily volatility.
The current market environment gives extra context, with the S&P 500 showing a positive short-term trend despite a neutral long-term view. This generally supportive background lowers the chance of broad market headwinds hurting individual stock breakouts, though sector-specific factors should still be watched given the energy sector's sensitivity to regulatory changes and commodity prices.
For investors looking for similar technical breakout opportunities, additional candidates can be found through the Technical Breakout Setups Screen, which filters for stocks showing both solid technical ratings and high-quality setup patterns.
Disclaimer: This analysis is based on technical indicators and historical performance patterns and should not be seen as investment advice. All investments carry risk, and past performance does not guarantee future results. Investors should do their own research and consider their risk tolerance before making investment decisions.