
Consider TELEFLEX INC (NYSE:TFX) as a top value stock, identified by our stock screening tool. TFX shines in terms of profitability, solvency, and liquidity, all while remaining very reasonably priced. Let's dive deeper into the analysis.
Valuation Insights: TFX
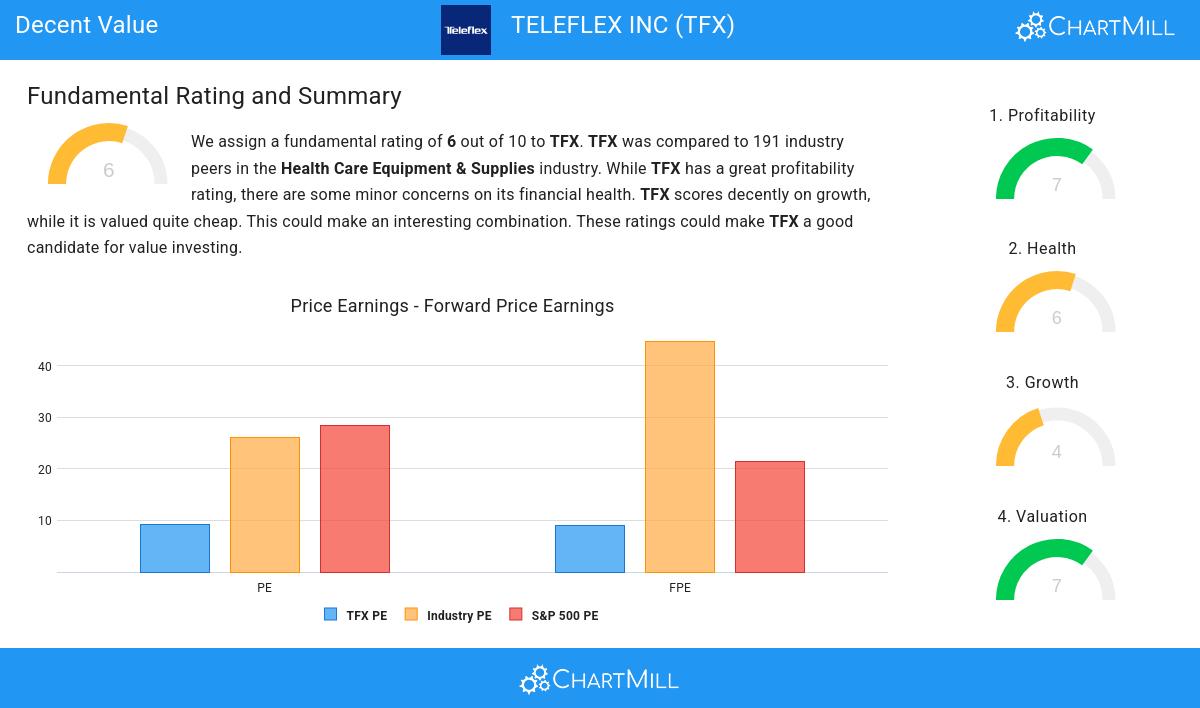
An integral part of ChartMill's stock analysis is the Valuation Rating, which spans from 0 to 10. This rating evaluates diverse valuation factors, including price to earnings and cash flows, while considering the stock's profitability and growth. TFX has received a 7 out of 10:
- TFX is valuated reasonably with a Price/Earnings ratio of 9.24.
- Based on the Price/Earnings ratio, TFX is valued cheaper than 95.81% of the companies in the same industry.
- Compared to an average S&P500 Price/Earnings ratio of 28.29, TFX is valued rather cheaply.
- TFX is valuated reasonably with a Price/Forward Earnings ratio of 9.07.
- Compared to the rest of the industry, the Price/Forward Earnings ratio of TFX indicates a rather cheap valuation: TFX is cheaper than 96.34% of the companies listed in the same industry.
- When comparing the Price/Forward Earnings ratio of TFX to the average of the S&P500 Index (21.32), we can say TFX is valued rather cheaply.
- Based on the Enterprise Value to EBITDA ratio, TFX is valued cheaply inside the industry as 91.62% of the companies are valued more expensively.
- Based on the Price/Free Cash Flow ratio, TFX is valued cheaper than 93.19% of the companies in the same industry.
- TFX has a very decent profitability rating, which may justify a higher PE ratio.
Profitability Insights: TFX
ChartMill's Profitability Rating offers a unique perspective on stock analysis, providing scores from 0 to 10. These ratings consider a wide range of profitability metrics and margins, both in comparison to industry peers and on their own merits. For TFX, the assigned 7 is a significant indicator of profitability:
- TFX's Return On Assets of 0.98% is fine compared to the rest of the industry. TFX outperforms 74.35% of its industry peers.
- TFX has a better Return On Equity (1.63%) than 75.92% of its industry peers.
- TFX has a better Return On Invested Capital (7.42%) than 83.77% of its industry peers.
- The 3 year average ROIC (7.21%) for TFX is below the current ROIC(7.42%), indicating increased profibility in the last year.
- TFX's Profit Margin of 2.29% is fine compared to the rest of the industry. TFX outperforms 75.39% of its industry peers.
- With an excellent Operating Margin value of 17.91%, TFX belongs to the best of the industry, outperforming 90.05% of the companies in the same industry.
Health Analysis for TFX
A critical element of ChartMill's stock evaluation is the Health Rating, which spans from 0 to 10. This rating considers multiple health factors, including liquidity and solvency, both in absolute terms and relative to industry peers. TFX has received a 6 out of 10:
- With a decent Altman-Z score value of 2.86, TFX is doing good in the industry, outperforming 71.20% of the companies in the same industry.
- TFX has a debt to FCF ratio of 3.25. This is a good value and a sign of high solvency as TFX would need 3.25 years to pay back of all of its debts.
- TFX has a Debt to FCF ratio of 3.25. This is amongst the best in the industry. TFX outperforms 86.91% of its industry peers.
- TFX has a Debt/Equity ratio of 0.36. This is a healthy value indicating a solid balance between debt and equity.
- TFX has a Current Ratio of 2.27. This indicates that TFX is financially healthy and has no problem in meeting its short term obligations.
More Decent Value stocks can be found in our Decent Value screener.
Check the latest full fundamental report of TFX for a complete fundamental analysis.
Disclaimer
This article should in no way be interpreted as advice. The article is based on the observed metrics at the time of writing, but you should always make your own analysis and trade or invest at your own responsibility.