
STEVEN MADDEN LTD (NASDAQ:SHOO) is a hidden gem unveiled by our stock screening tool, featuring a promising dividend outlook alongside solid fundamentals. NASDAQ:SHOO demonstrates decent financial health and profitability while ensuring a sustainable dividend. Let's break it down further.
Unpacking NASDAQ:SHOO's Dividend Rating
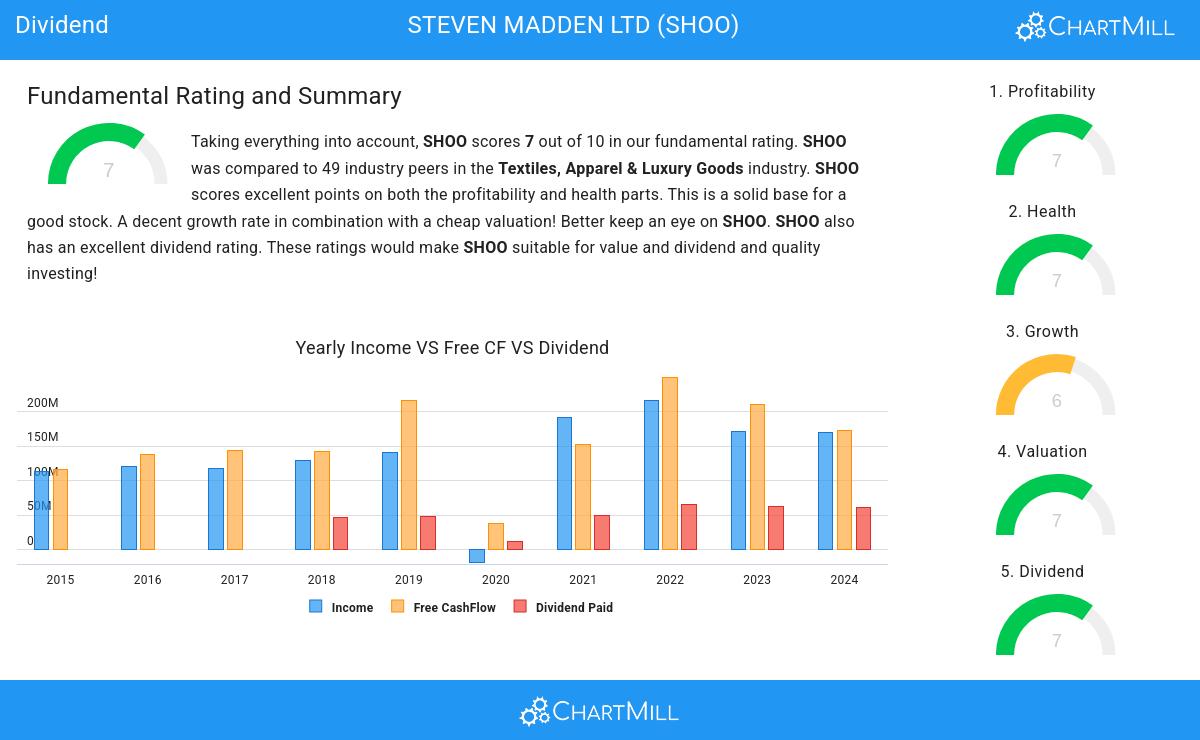
An integral part of ChartMill's stock analysis is the Dividend Rating, which spans from 0 to 10. This rating evaluates diverse dividend factors, including yield, historical data, growth, and sustainability. NASDAQ:SHOO has received a 7 out of 10:
- SHOO's Dividend Yield is rather good when compared to the industry average which is at 3.25. SHOO pays more dividend than 81.63% of the companies in the same industry.
- SHOO's Dividend Yield is a higher than the S&P500 average which is at 2.33.
- On average, the dividend of SHOO grows each year by 7.90%, which is quite nice.
- SHOO has been paying a dividend for over 5 years, so it has already some track record.
- SHOO pays out 36.03% of its income as dividend. This is a sustainable payout ratio.
- SHOO's earnings are growing more than its dividend. This makes the dividend growth sustainable.
Looking at the Health
A critical element of ChartMill's stock evaluation is the Health Rating, which spans from 0 to 10. This rating considers multiple health factors, including liquidity and solvency, both in absolute terms and relative to industry peers. NASDAQ:SHOO has received a 7 out of 10:
- SHOO has no outstanding debt. Therefor its Debt/Equity and Debt/FCF ratios are 0 and belong to the best of the industry.
- A Current Ratio of 2.16 indicates that SHOO has no problem at all paying its short term obligations.
- The Quick ratio of SHOO (1.54) is better than 73.47% of its industry peers.
How do we evaluate the Profitability for NASDAQ:SHOO?
ChartMill's Profitability Rating offers a unique perspective on stock analysis, providing scores from 0 to 10. These ratings consider a wide range of profitability metrics and margins, both in comparison to industry peers and on their own merits. For NASDAQ:SHOO, the assigned 7 is a significant indicator of profitability:
- SHOO has a better Return On Assets (12.00%) than 87.76% of its industry peers.
- SHOO has a Return On Equity of 19.98%. This is in the better half of the industry: SHOO outperforms 79.59% of its industry peers.
- The Return On Invested Capital of SHOO (18.78%) is better than 85.71% of its industry peers.
- Measured over the past 3 years, the Average Return On Invested Capital for SHOO is significantly above the industry average of 11.80%.
- SHOO has a better Profit Margin (7.42%) than 75.51% of its industry peers.
- SHOO's Operating Margin of 10.58% is fine compared to the rest of the industry. SHOO outperforms 79.59% of its industry peers.
More Best Dividend stocks can be found in our Best Dividend screener.
For an up to date full fundamental analysis you can check the fundamental report of SHOO
Disclaimer
This is not investing advice! The article highlights some of the observations at the time of writing, but you should always make your own analysis and invest based on your own insights.