
Technical investing often uses identifying stocks with strong existing momentum that are also forming consolidation patterns, offering a clear entry point for possible breakouts. This method combines two key metrics: the technical rating, which looks at the overall health and trend strength of a stock, and the setup quality, which measures how well the stock is placed for a near-term move. By focusing on securities that score well in both areas, investors try to capture upward movements while handling risk through defined support and resistance levels.
Technical Strength and Trend Consistency
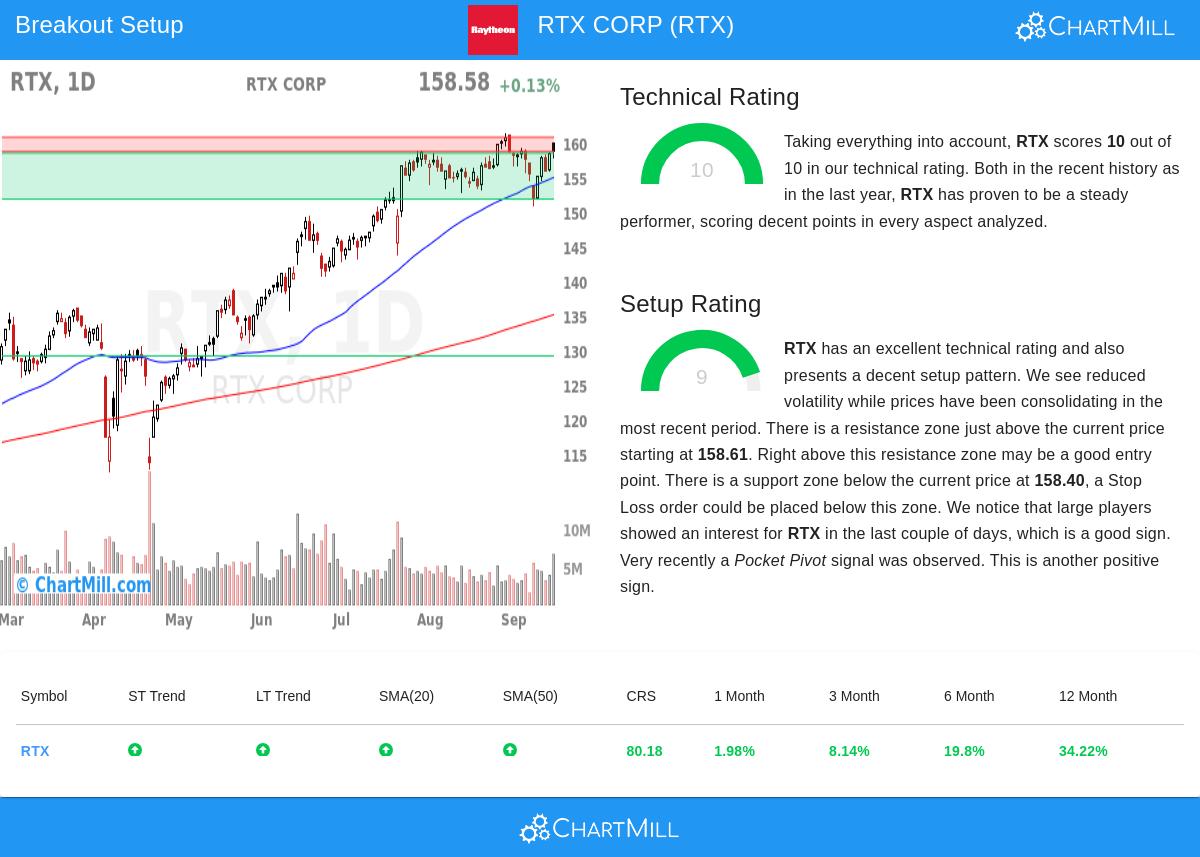
RTX CORP (NYSE:RTX) shows very good technical health, getting a perfect rating of 10 out of 10. This score reflects solid performance across multiple timeframes and indicators, which is important for technical strategies as it points to maintained momentum and lowers the chance of false breakouts. Key factors adding to this rating include:
- Both short-term and long-term trends are positive, showing alignment across different investment horizons.
- The stock is trading near its 52-week high and has done better than 80% of all stocks over the past year, pointing to strong relative strength.
- All major moving averages (20-day, 50-day, 100-day, and 200-day) are rising, confirming wide upward momentum.
These elements propose that RTX is not only in a solid uptrend but also keeps consistency, which is important for breakout strategies looking to take advantage of continued advances rather than short-lived spikes.
Setup Quality and Consolidation Pattern
Adding to its technical strength, RTX shows a high setup rating of 9, indicating it is in a consolidation phase that often comes before a breakout. This is needed for timing entries, as it helps find points where the stock is neither overextended nor stagnant, offering a balance between opportunity and risk management. Notable aspects include:
- Prices have been trading within a defined range ($150.61 to $161.26) over the past month, lowering volatility and building a base for the next move.
- A resistance zone exists between $158.61 and $160.67; a break above this could signal the start of a new upward leg.
- Support is well-established around $151.74 to $158.40, giving a clear area for stop-loss orders to handle possible downsides.
Additionally, recent signals such as increased interest from large players and a pocket pivot, a volume-backed price move, add confidence to the setup, suggesting institutional accumulation that often comes with significant breakouts.
Trade Considerations and Market Context
With the S&P500 showing positive trends in both the short and long term, the wider market environment supports continued strength in leading stocks like RTX. The technical report proposes a possible entry above $160.68, targeting a breakout above resistance, with a stop-loss around $150.60 to limit downside risk. This fits with the strategy of entering on strength while protecting capital through predefined exits.
For investors interested in finding similar opportunities, the Technical Breakout Setups screen regularly finds stocks with high technical and setup ratings, giving a selected list of possible breakout candidates based on the method discussed here.
Disclaimer: This analysis is based on technical metrics and historical performance and should not be considered investment advice. Always conduct your own research and consider your risk tolerance before making any investment decisions.