
Technical breakout strategies aim to identify stocks with strong momentum that are consolidating in preparation for their next significant price move. By combining technical health assessments with setup quality metrics, investors can pinpoint opportunities where a stock's technical strength aligns with a favorable entry point. This approach helps traders participate in existing trends while managing risk through clearly defined support levels.
RUSH STREET INTERACTIVE INC (NYSE:RSI) has become a notable candidate using this methodology, demonstrating very good technical characteristics alongside a notable consolidation pattern. The online gaming operator shows notable strength across multiple timeframes, positioning it as a potential breakout candidate for technically-oriented investors.
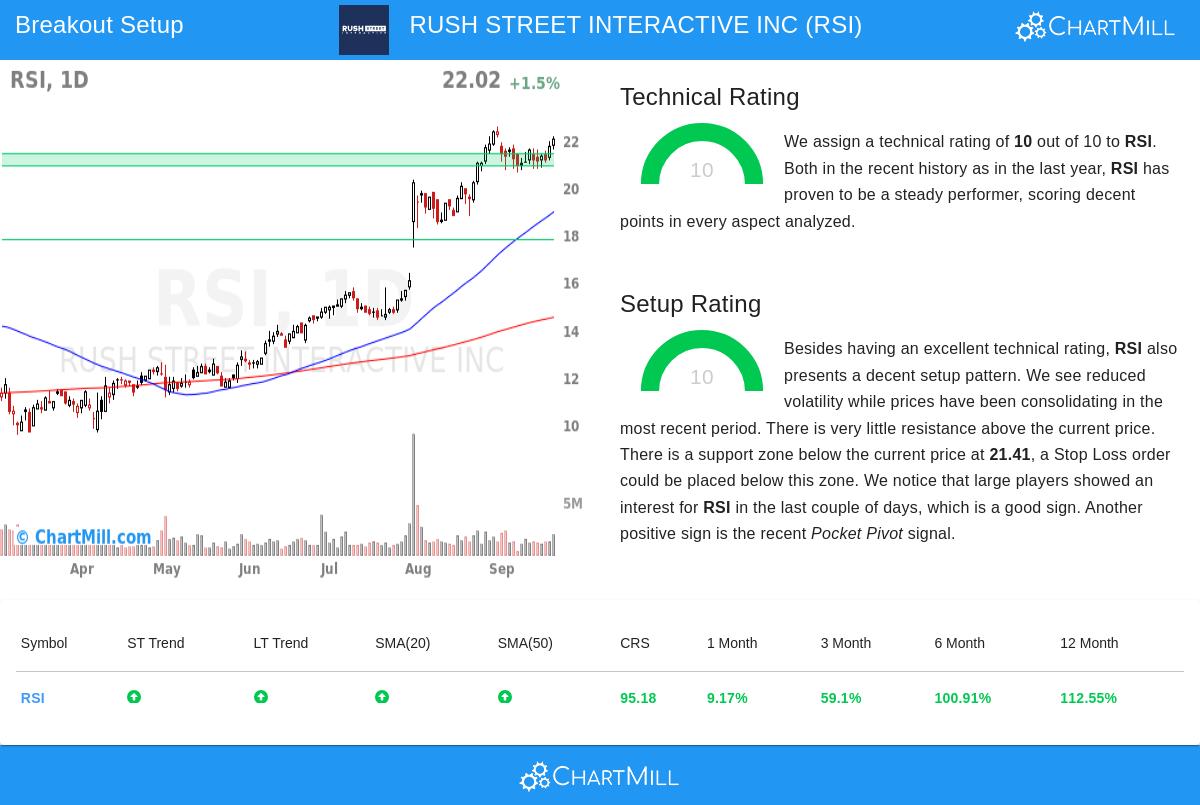
Technical Strength Assessment
Rush Street Interactive exhibits very good technical health, earning a perfect technical rating score of 10. This maximum rating reflects superior performance across multiple critical dimensions that technical analysts prioritize when identifying leading stocks. The company's technical strength manifests through several key attributes:
- Both long-term and short-term trends register as positive, indicating aligned momentum across different time horizons
- The stock outperforms 95% of all stocks on a yearly performance basis, demonstrating significant relative strength
- Within its Hotels, Restaurants & Leisure industry, RSI surpasses 97% of 133 peer companies
- All major moving averages (20-day through 200-day) show rising trajectories, confirming the strength of the upward trend
These technical characteristics matter because they identify stocks with existing momentum and relative strength, qualities that often precede continued outperformance. Stocks showing consistent strength across multiple timeframes typically attract continued institutional interest, providing fuel for extended moves.
Setup Quality and Consolidation Pattern
Beyond its technical excellence, Rush Street Interactive presents an exceptional setup quality with a perfect score of 10. This indicates the stock has been trading in a tight consolidation range, reducing volatility and creating a well-defined risk framework for potential breakout trades. The setup analysis reveals several favorable conditions:
- Prices have consolidated between $20.08 and $22.55 over the past month, creating a defined trading range
- Reduced volatility during this consolidation period provides a lower-risk entry opportunity
- Minimal resistance exists above current price levels, suggesting room for upward movement
- Strong support appears at $21.41, creating a logical stop-loss placement level
- Recent pocket pivot signals and institutional accumulation indicate smart money interest
The quality of the setup matters significantly because it identifies moments when technically strong stocks pause to consolidate gains. These consolidation periods often precede the next leg higher, offering favorable risk-reward opportunities with clearly defined exit points should the breakout fail to materialize.
Risk Management Considerations
The technical analysis suggests a potential trade setup with an entry at $22.17 (above the recent consolidation high) and a stop loss at $20.88 (below the support zone). This creates a defined risk of approximately 5.82% on the trade position. The presence of multiple support levels at $21.41, $17.78, and lower prices provides additional downside protection for various trading timeframes.
Traders should note that while the technical setup appears notable, no pattern guarantees success. The upcoming earnings calendar, sector rotation patterns, and broader market conditions should all factor into any trading decision. The current positive trends in both short-term and long-term S&P 500 movements provide a supportive backdrop for breakout attempts.
Exploring Additional Opportunities
For investors interested in finding similar technical breakout setups, the Technical Breakout Setups screen regularly identifies stocks combining strong technical ratings with high-quality consolidation patterns. This screening methodology helps traders systematically identify potential opportunities across the market.
Disclaimer: This analysis is for informational purposes only and does not constitute investment advice, recommendation, or endorsement of any security. Trading stocks involves risk of loss, and past performance does not guarantee future results. Always conduct your own research and consider consulting with a qualified financial professional before making investment decisions.