
Technical analysis investors often look for stocks showing both good existing momentum and clear consolidation patterns that indicate possible breakouts. One method uses ChartMill's own Technical Rating, which assesses general technical condition, with its Setup Quality Rating, which finds consolidation phases providing good risk-reward entry spots. Stocks with good scores on both measures often show chances where existing uptrends pause briefly, possibly allowing for planned entries before new upward moves.
Technical Strength Assessment
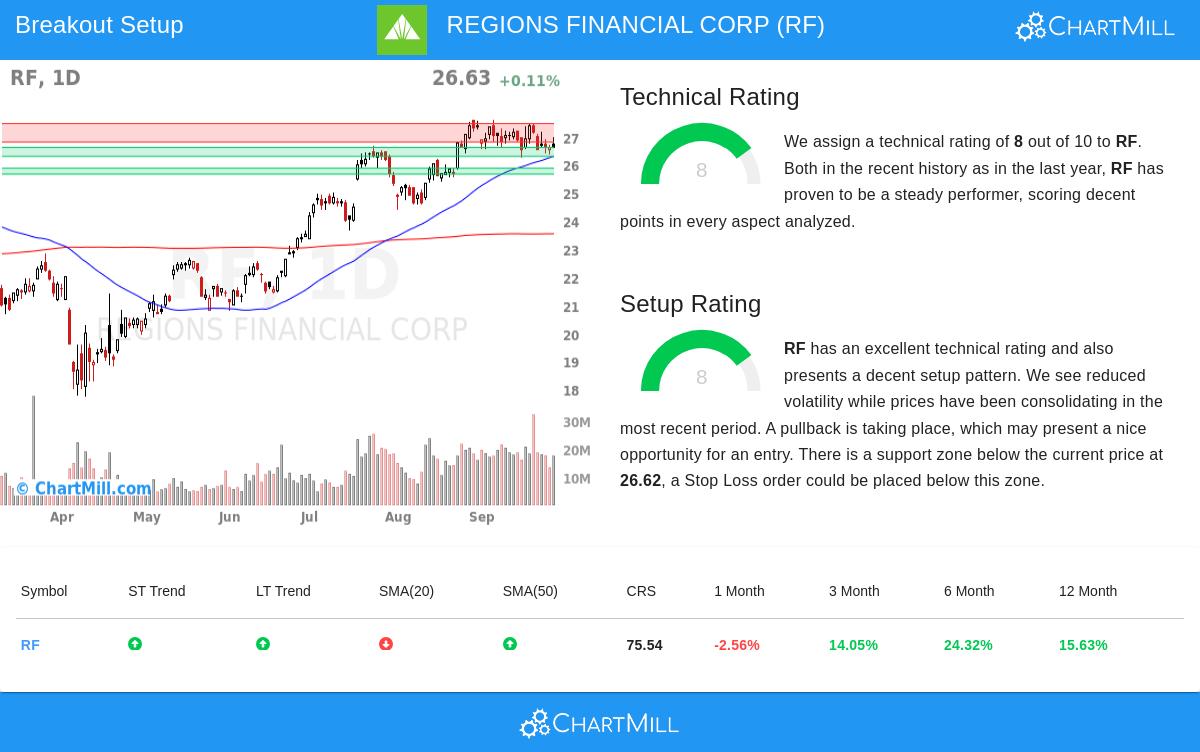
REGIONS FINANCIAL CORP (NYSE:RF) shows good technical features according to its ChartMill Technical Rating of 8 out of 10. This rating looks at several parts including relative strength, trend direction, and moving average placement across different time periods. The stock's technical base looks firm based on a few main points:
- Both short-term and long-term trends are positive, showing steady upward momentum
- The stock does better than 75% of all stocks on yearly performance measures
- Within the banking industry with 392 stocks, RF does better than 72% of its competitors
- All main moving averages (20-day, 50-day, 100-day, and 200-day) are currently below the current price, confirming the positive structure
These technical features are important for breakout methods because stocks with good existing momentum are more likely to maintain breakouts. When a technically sound stock moves out of consolidation, the chance of continued upward movement grows a lot compared to weaker stocks trying breakouts.
Setup Quality and Consolidation Pattern
The Setup Quality Rating of 8 points out RF's current consolidation phase, which shows a possibly good risk-reward situation for technical traders. A few things add to this view:
- Recent price movement has kept trading in a narrow area between $26.24 and $27.61 over the last month
- The shape looks like a bull flag pattern, where prices move down a little after a good rise
- Several support areas are below current levels, with the closest important support between $26.30 and $26.62
- Lower volatility during this consolidation time indicates less selling pressure
For breakout methods, good-quality setups like this give clearer entry and exit points. The consolidation lets traders put stop losses below known support levels while getting ready for possible gains if the stock moves above resistance. The automated study indicates a possible entry at $26.82 with a stop loss at $26.29, meaning a contained risk of about 2%.
Support and Resistance Dynamics
The technical report finds clear support and resistance levels that help outline the possible breakout situation. The closest resistance area is between $26.81 and $27.47, made from a mix of trendlines and moving averages across several time periods. A clear move above this resistance could signal the next upward phase. At the same time, the several support levels below current prices give technical traders sensible spots for stop loss placement, helping to control risk if the expected breakout does not happen.
Market Context and Relative Performance
While RF trades in the higher part of its 52-week range, it is a little behind the S&P 500 Index, which is currently testing new highs. This relative place might show a catch-up chance if the wider market keeps its positive path. The stock's average daily volume of about 17.8 million shares provides enough liquidity for position entry and exit, an important point for technical traders managing position sizes.
For investors looking for similar technical breakout chances, the Technical Breakout Setups screen regularly finds stocks combining good technical ratings with high-quality setup patterns across different market areas.
Disclaimer: This analysis is based on technical indicators and automated pattern recognition. It does not constitute investment advice or recommendations to buy, sell, or hold any security. Investors should conduct their own research, consider their risk tolerance, and consult with financial advisors before making investment decisions. Past performance does not guarantee future results.