
Investors looking for long-term growth opportunities at reasonable prices often use methods that combine fundamental study with disciplined valuation measures. One well-known method comes from Peter Lynch, the famous fund manager who delivered outstanding results at Fidelity's Magellan Fund by concentrating on companies with lasting growth, sound financial condition, and appealing valuations. His approach stresses investing in businesses that are easy to comprehend, have sensible debt amounts, and show reliable profit generation, all while trading at prices that do not overstate their future potential. This method tries to find firms that can provide stable returns without the instability linked to speculative high-growth stocks.
Financial Health and Stability
QUALCOMM INC (NASDAQ:QCOM) displays several traits that match Lynch's focus on financial strength. The company has a current ratio of 3.19, showing a large ability to cover immediate liabilities, a key point for Lynch, who liked companies with solid balance sheets to endure economic slumps. Also, QUALCOMM's debt-to-equity ratio of 0.54, while a bit higher than Lynch's ideal level of 0.25, is still acceptable and is backed by very good free cash flow coverage. The company's Altman-Z score of 6.35 further supports financial soundness, greatly lowering bankruptcy risk worries that could trouble long-term investors.
Profitability and Efficiency Measures
The company's profitability picture is especially notable for growth-at-a-reasonable-price investors:
- Return on equity of 42.55% is much higher than Lynch's 15% minimum standard
- Return on invested capital of 20.40% shows effective capital use
- Profit margin of 26.77% is near the best in the semiconductor industry
- Operating margin of 28.10% indicates good operational effectiveness
These measures meet Lynch's focus on companies that produce significant returns from their activities, making sure that growth leads to shareholder value in a meaningful way instead of just increasing sales without matching profits.
Growth Path and Sustainability
QUALCOMM's growth pattern fits well with Lynch's liking for lasting expansion instead of fast but possibly unreliable growth:
- Five-year EPS growth averaging 23.53% is within Lynch's preferred 15-30% span
- Revenue growth of 14.76% per year over recent years shows steady business growth
- While future growth estimates slow to about 8.66% for EPS and 5.10% for revenue, this still represents good expansion
Lynch specifically warned against companies growing too fast, as that speed often cannot be maintained. QUALCOMM's past growth within sensible limits, together with continued positive estimates, indicates the company can keep its path without the instability that worries long-term investors.
Valuation Evaluation
The company's valuation measures present a strong case for price-aware growth investors:
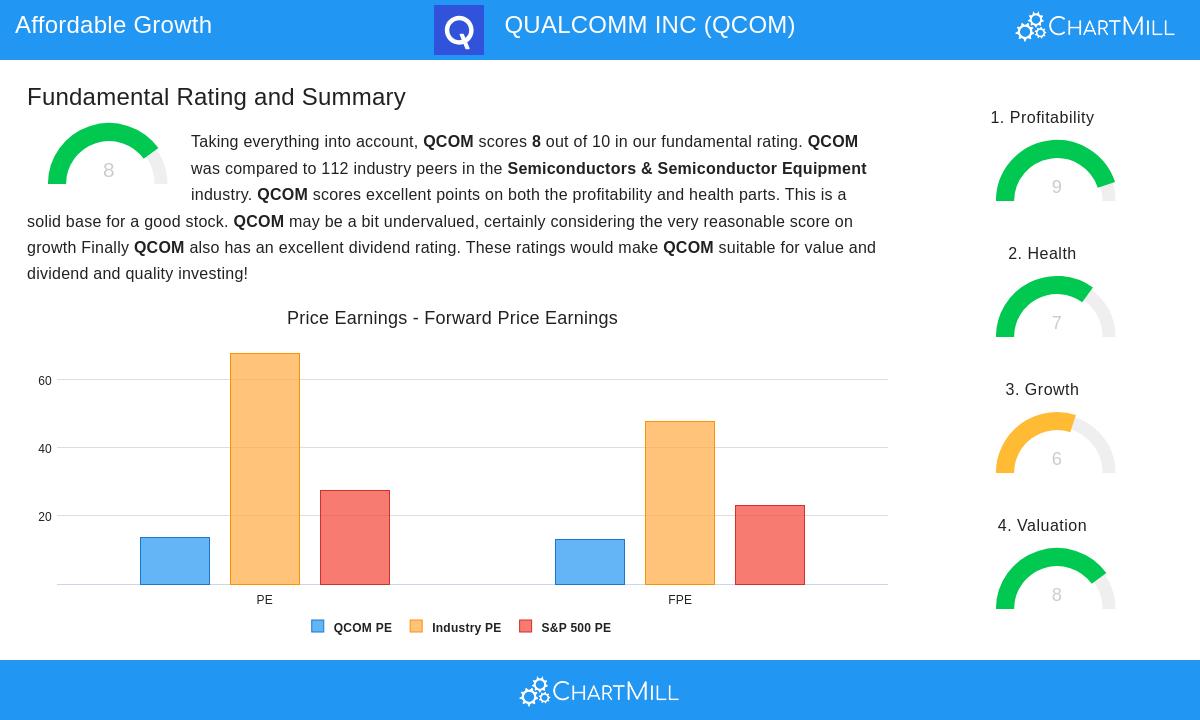
- P/E ratio of 13.80 looks good compared to industry averages and the wider market
- Forward P/E of 13.13 shows steady earnings forecasts
- PEG ratio of 0.59 is much lower than Lynch's limit of 1.0
- Enterprise value to EBITDA and price-to-free-cash-flow ratios are good within the industry
Lynch gave special attention to the PEG ratio, which changes the standard P/E multiple for growth forecasts. QUALCOMM's notably below-1.0 PEG implies the market might be pricing its growth potential too low relative to its current earnings strength.
Dividend and Shareholder Returns
For investors looking for total return, QUALCOMM gives extra appeal through its shareholder return policy:
- Dividend yield of 2.15% supplies an income part to total returns
- Payout ratio of 32.79% shows a maintainable dividend distribution
- Ten-year history of dependable and increasing dividends shows dedication to shareholders
- Share count decrease over five years implies effective capital return programs
While Lynch did not specifically look for dividend stocks, he valued companies that sensibly returned capital to shareholders, seeing it as proof of financial control and belief in future cash flows.
Fundamental Study Summary
According to Chartmill's thorough fundamental analysis, QUALCOMM gets an overall rating of 8 out of 10, with especially high marks in profitability (9/10) and valuation (8/10). The study mentions the company's "exceptional health and profitability ratings" within the semiconductor industry, calling it "very significant for value and dividend and quality investing." The report points out QUALCOMM's excellent return measures, getting better margins, and sensible valuation compared to both industry competitors and broader market indexes.
Investment Points
While QUALCOMM presents a strong case for GARP investors, several factors need continued watching. The company works in the competitive semiconductor field, where technology shifts can quickly change competitive situations. The moderate easing in estimated growth rates, while still positive, suggests investors should check the company's capacity to keep its market standing and grow into new revenue sources. Also, while the present debt level seems acceptable, major rises in borrowing could change the risk picture.
For investors wanting to find similar opportunities, other companies meeting Peter Lynch's standards can be located using this customized stock screen.
Disclaimer: This study is based on publicly available information and is given for educational purposes only. It does not form investment advice, nor does it suggest buying or selling any security. Investors should do their own research and talk with financial advisors before making investment choices.