
Palantir Technologies Inc. (NASDAQ:PLTR) Shows Strong Growth and Technical Momentum
By Mill Chart
Last update: Oct 2, 2025
For investors looking for companies that mix solid fundamental growth with positive technical patterns, a methodical process can help find good prospects. One method uses filters for stocks that display three main traits: a strong growth momentum picture, good technical condition, and a helpful chart formation. This process tries to find companies with improving business results while trading in ways that hint at a possible extension of their upward move. The method uses numerical scores that assess earnings momentum, sales increases, profit margin improvement, and analyst rating changes together with technical tools measuring trend health and consolidation pattern.
Strong Growth Momentum Picture
PALANTIR TECHNOLOGIES INC-A (NASDAQ:PLTR) displays positive growth traits that add to its High Growth Momentum Rating of 8 out of 10. The company's fundamental results indicate notable improvement across several measures important for growth investors looking for companies with increasing business speed.
-
Earnings Growth: The company has reported very good EPS growth of 65.6% over the last twelve months, with the latest quarter showing even better speed. The most recent quarter recorded 77.8% year-over-year EPS growth, following earlier quarters that showed 62.5% and 75% growth.
-
Sales Increase: Revenue growth stays healthy at 38.8% each year, with quarterly sales growth speeding up from 30% to 48% in the latest quarter. This pattern of increasing speed is especially notable as it points to rising business speed.
-
Profitability Gains: The profit margin has grown noticeably from 9.5% to 32.6% over the last three quarters, showing better operational effectiveness and pricing ability.
-
Estimate Changes: Analysts have raised their future estimates meaningfully, with next-year EPS forecasts increasing 10.8% and revenue estimates going up 6.7% over the last three months, showing more positive views about the company's future.
These fundamental traits match what high growth momentum investors usually look for, as they show not only good total growth but also improving business results across several areas.
Technical Condition Evaluation
The technical view for Palantir looks similarly positive, with the stock receiving a full Technical Rating of 10 out of 10. This very good rating shows wide strength across several technical areas that technical analysts focus on when judging trend quality and momentum continuation.
-
Trend Steadiness: Both near-term and longer-term trends stay clearly positive, with the stock trading significantly above its important moving averages. The 20-day SMA at $172.25, 50-day SMA at $167.96, and 200-day SMA at $120.51 all move upward, confirming the health of the current trend.
-
Comparative Performance: Palantir shows very good comparative strength, doing better than 98% of all stocks in the market over the last year and 96% of software industry counterparts. This leading position is important for momentum investors who favor stocks displaying market-leading traits.
-
Price Location: The stock now trades close to its 52-week high of $190, usually a positive technical trait that shows continued demand and little supply above.
The detailed technical analysis report gives more information on support and resistance levels that traders can use for trade management.
Formation Quality Review
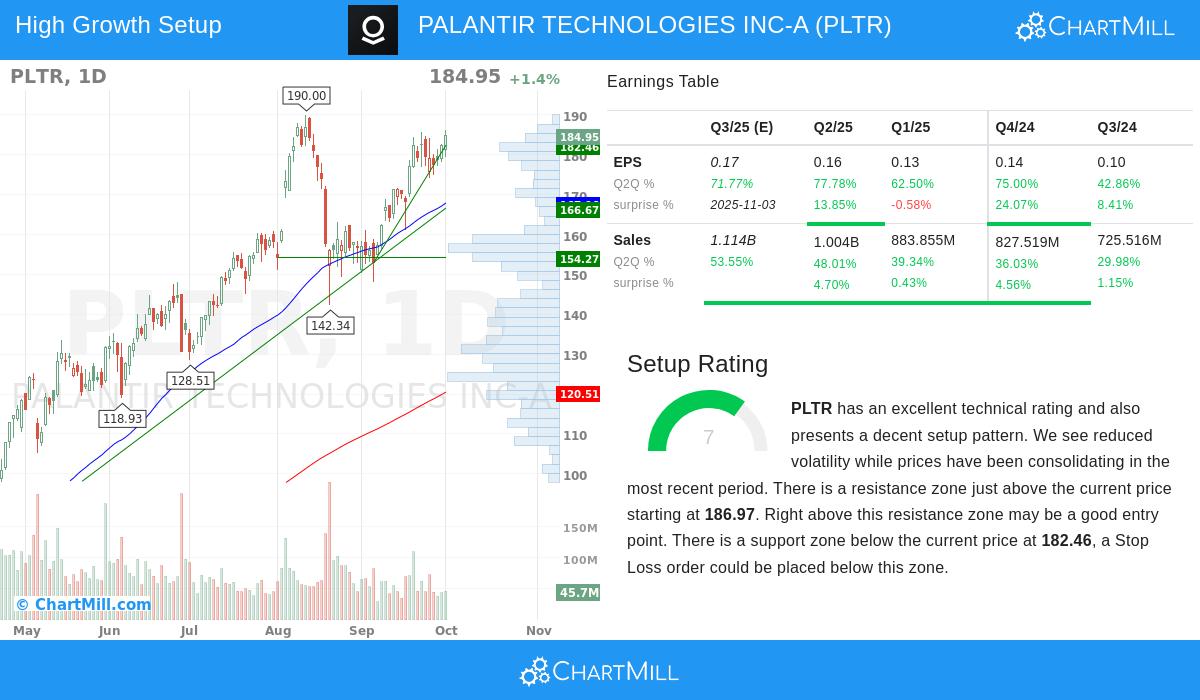
With a Setup Rating of 7, Palantir shows a possibly good pattern for traders looking for clear risk-reward situations. The formation review finds particular technical states that often come before notable price moves.
-
Consolidation Formation: The stock has been trading in a set band between $148.04 and $186.28 over the last month, letting it process possible overbought states while keeping its larger upward move structure.
-
Support Framework: Several support areas exist below present prices, with the closest important support between $177.56 and $182.46. This area joins several trendlines and moving averages across different timeframes, possibly giving a sensible zone for stop-loss setting.
-
Breakout Chance: Resistance starts near $186.97, and a clear move past this point could indicate a continuation of the upward move. The lower volatility during the recent consolidation may have stored energy for the next directional move.
The mix of good technical health with a set consolidation pattern creates what technical analysts often call a "coiled spring" formation, where a stock with basic strength pauses before possibly continuing its trend.
Investment Points
For investors using a high growth momentum plan, Palantir is an interesting example where fundamental improvement matches technical health. The company's gaining profitability, speeding sales growth, and positive estimate changes supply the fundamental base, while the technical view indicates the stock keeps leadership traits with a set risk structure. The present formation allows for possible entry spots with clearly set support levels that can assist with risk control.
The method used to find Palantir can be used to locate similar prospects. Investors can explore additional high growth momentum stocks with technical breakout formations using the same filtering criteria that highlighted this possible prospect.
Disclaimer: This review is for information only and does not make up investment guidance, a suggestion, or support of any security. Investors should do their own research and think about their personal money situation before making investment choices. Past results do not ensure future outcomes.
NASDAQ:PLTR (11/13/2025, 10:24:10 AM)
177.11
-7.06 (-3.83%)
Find more stocks in the Stock Screener
PLTR Latest News and Analysis


