
Consider PDD HOLDINGS INC (NASDAQ:PDD) as an affordable growth stock, identified by our stock screening tool. PDD is showcasing impressive growth figures and is well-positioned in terms of profitability, solvency, and liquidity. Moreover, it seems to be priced reasonably. Let's dive deeper into the analysis.
Assessing Growth for PDD
To evaluate a stock's growth potential, ChartMill utilizes a Growth Rating on a scale of 0 to 10. This comprehensive assessment considers various growth aspects, including historical and estimated EPS and revenue growth. PDD has achieved a 8 out of 10:
- The Earnings Per Share has grown by an impressive 78.54% over the past year.
- Measured over the past years, PDD shows a very strong growth in Earnings Per Share. The EPS has been growing by 106.51% on average per year.
- Looking at the last year, PDD shows a very strong growth in Revenue. The Revenue has grown by 59.04%.
- The Revenue has been growing by 67.20% on average over the past years. This is a very strong growth!
- The Earnings Per Share is expected to grow by 10.29% on average over the next years. This is quite good.
- The Revenue is expected to grow by 14.39% on average over the next years. This is quite good.
Valuation Examination for PDD
ChartMill assigns a proprietary Valuation Rating to each stock. The score is computed by evaluating various valuation aspects, like price to earnings and free cash flow, both absolutely as relative to the market and industry. PDD was assigned a score of 6 for valuation:
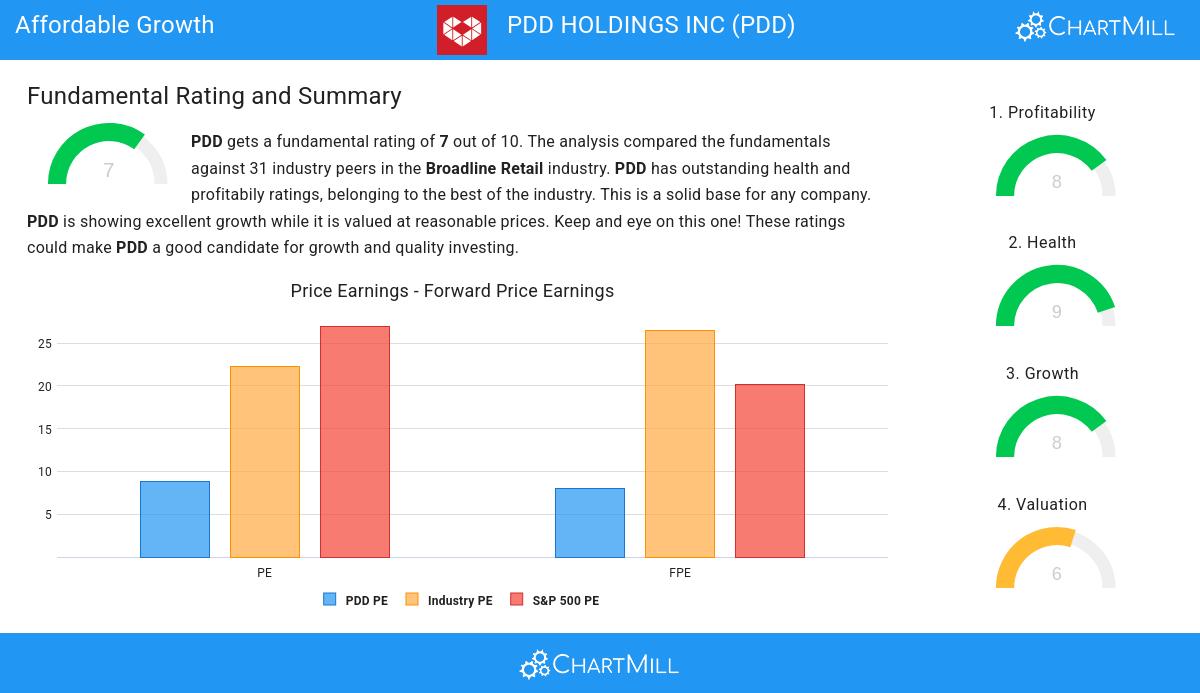
- Based on the Price/Earnings ratio of 8.83, the valuation of PDD can be described as reasonable.
- PDD's Price/Earnings ratio is a bit cheaper when compared to the industry. PDD is cheaper than 74.19% of the companies in the same industry.
- The average S&P500 Price/Earnings ratio is at 26.98. PDD is valued rather cheaply when compared to this.
- With a Price/Forward Earnings ratio of 8.04, the valuation of PDD can be described as very reasonable.
- Compared to the rest of the industry, the Price/Forward Earnings ratio of PDD indicates a rather cheap valuation: PDD is cheaper than 87.10% of the companies listed in the same industry.
- PDD's Price/Forward Earnings ratio indicates a rather cheap valuation when compared to the S&P500 average which is at 20.19.
- The low PEG Ratio(NY), which compensates the Price/Earnings for growth, indicates a rather cheap valuation of the company.
- The excellent profitability rating of PDD may justify a higher PE ratio.
- A more expensive valuation may be justified as PDD's earnings are expected to grow with 15.52% in the coming years.
Understanding PDD's Health
ChartMill assigns a proprietary Health Rating to each stock. The score is computed by evaluating various liquidity and solvency ratios and ranges from 0 to 10. PDD was assigned a score of 9 for health:
- PDD has an Altman-Z score of 5.73. This indicates that PDD is financially healthy and has little risk of bankruptcy at the moment.
- With an excellent Altman-Z score value of 5.73, PDD belongs to the best of the industry, outperforming 87.10% of the companies in the same industry.
- There is no outstanding debt for PDD. This means it has a Debt/Equity and Debt/FCF ratio of 0 and it is amongst the best of the sector and industry.
- PDD has a Current Ratio of 2.21. This indicates that PDD is financially healthy and has no problem in meeting its short term obligations.
- PDD has a Current ratio of 2.21. This is in the better half of the industry: PDD outperforms 77.42% of its industry peers.
- A Quick Ratio of 2.21 indicates that PDD has no problem at all paying its short term obligations.
- Looking at the Quick ratio, with a value of 2.21, PDD belongs to the top of the industry, outperforming 93.55% of the companies in the same industry.
Understanding PDD's Profitability
Discover ChartMill's exclusive Profitability Rating, a proprietary metric that assesses stocks on a scale of 0 to 10. It takes into consideration various profitability ratios and margins, both in absolute terms and relative to industry peers. Notably, PDD has achieved a 8:
- With an excellent Return On Assets value of 22.26%, PDD belongs to the best of the industry, outperforming 100.00% of the companies in the same industry.
- PDD has a better Return On Equity (35.89%) than 93.55% of its industry peers.
- PDD has a better Return On Invested Capital (28.81%) than 100.00% of its industry peers.
- Measured over the past 3 years, the Average Return On Invested Capital for PDD is significantly above the industry average of 11.36%.
- The last Return On Invested Capital (28.81%) for PDD is above the 3 year average (25.13%), which is a sign of increasing profitability.
- With an excellent Profit Margin value of 28.55%, PDD belongs to the best of the industry, outperforming 100.00% of the companies in the same industry.
- In the last couple of years the Profit Margin of PDD has grown nicely.
- PDD's Operating Margin of 27.53% is amongst the best of the industry. PDD outperforms 100.00% of its industry peers.
- PDD's Operating Margin has improved in the last couple of years.
- Looking at the Gross Margin, with a value of 60.92%, PDD belongs to the top of the industry, outperforming 83.87% of the companies in the same industry.
More Affordable Growth stocks can be found in our Affordable Growth screener.
Check the latest full fundamental report of PDD for a complete fundamental analysis.
Keep in mind
This article should in no way be interpreted as advice. The article is based on the observed metrics at the time of writing, but you should always make your own analysis and trade or invest at your own responsibility.