
nVent Electric PLC (NYSE:NVT) has appeared as a notable candidate in a technical breakout screen made to find stocks with solid basic momentum and good entry setups. The method for this screen uses two specific metrics: the ChartMill Technical Rating, which judges a stock’s total technical condition and trend force, and the ChartMill Setup Quality Rating, which checks for a consolidation pattern that might come before a large price move. Stocks that get high marks on both metrics are seen as top candidates for breakout trading plans, as they join solid price trends with tactical entry chances.
Technical Force and Trend Performance
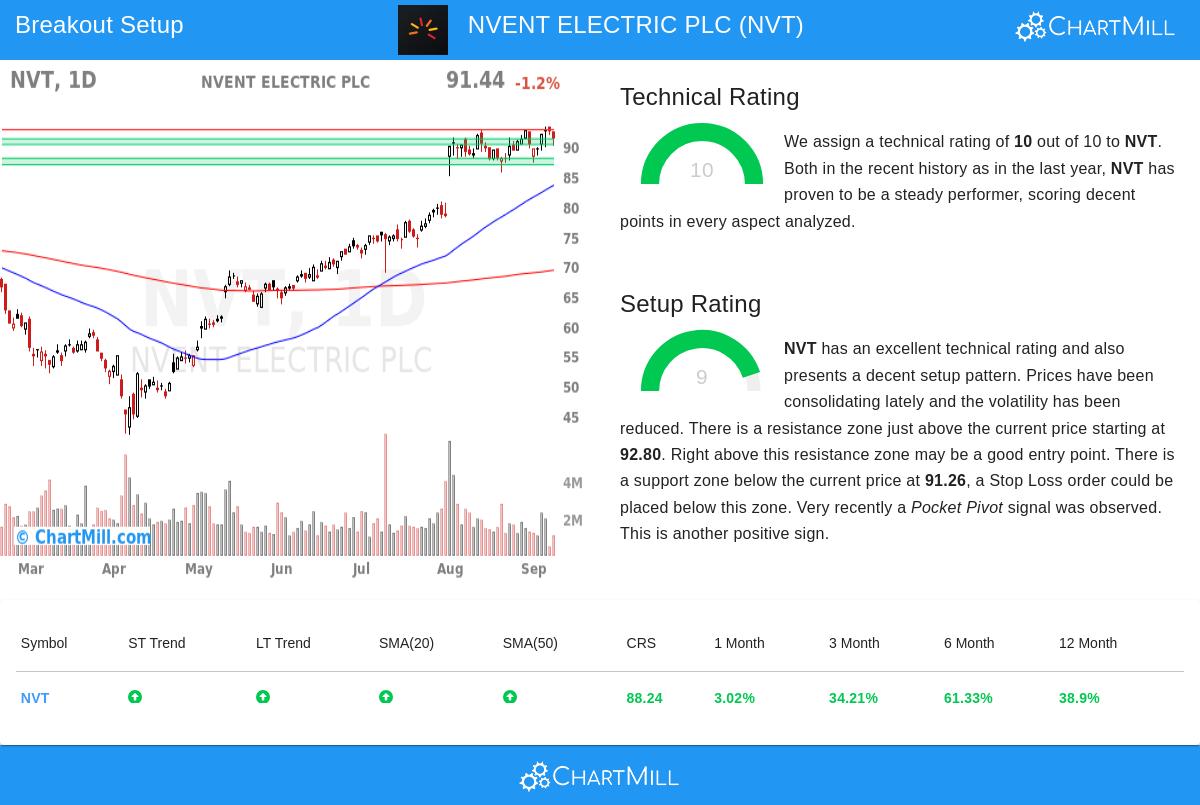
nVent Electric shows outstanding technical force, getting a top Technical Rating of 10. This score shows very good performance over many timeframes and technical indicators. The stock shows solid relative force, doing better than 88% of all stocks in the market over the last year and standing above 73% of its peers in the Electrical Equipment industry. Both long-term and short-term trends are strongly positive, with the stock trading near its 52-week high of $93.32. Key moving averages, including the 20-day, 50-day, 100-day, and 200-day SMAs, are all pointing up, confirming the force and steadiness of the bullish trend. This technical soundness is key for breakout plans, as it shows the stock is placed within a leading group of the market, bettering the chance that a breakout will hold.
Consolidation and Setup Quality
Adding to its very good technical rating, nVent Electric also has a high Setup Quality Rating of 9, showing the stock is in a constructive consolidation phase. Recent trading activity has been held to a range between $85.72 and $93.32, with the stock now testing the upper edge of this area. This kind of price pressure often comes before directional moves, as it shows a balance between supply and demand before one side wins. The setup is made better by clear support and resistance levels, with a support area between $90.30 and $91.26 and resistance near $92.80. Also, a recent Pocket Pivot signal, a volume-backed bullish pattern, points to institutional accumulation. These points are key for breakout traders, as they give a clear risk structure: an entry point above resistance and a stop-loss level below support.
Trade Structure and Risk Points
Based on the technical and setup reviews, a sample trade structure proposes an entry above $92.81, just above the current resistance, with a stop-loss set below $90.29. This setup caps the possible loss to about 2.72% of the trade value, giving a good risk-reward ratio for traders using careful position sizing. It is important to note, however, that the nearness of the stop-loss to the entry point might lead to a greater chance of being stopped out from normal price changes. Traders might want to change these levels based on their risk comfort and time frame. For a more detailed look at the technicals, the full ChartMill technical report gives more background and charts.
Market Setting and View
The wider market setting seems supportive, with the S&P 500 showing positive trends on both a short-term and long-term basis. This matches well with nVent’s solid technical profile, as breakouts often have better success rates in bullish markets. The company’s focus on electrical connection and protection solutions, including products for data centers, industrial uses, and critical infrastructure, places it in a rising part of the economy, which may further support investor interest.
For traders and investors looking for more breakout ideas, the Technical Breakout Setups screen is updated daily and gives a selected list of stocks showing similar technical and setup traits.
,
Disclaimer: This article is for informational purposes only and does not constitute investment advice. The analysis presented is based on technical metrics and should not be the sole basis for making investment decisions. Always conduct your own research and consider consulting a financial advisor before trading.