
Why NYSE:NEM qualifies as a high growth stock.
By Mill Chart
Last update: Oct 2, 2024
NEWMONT CORP (NYSE:NEM) has been identified as a Technical Breakout Setup Pattern by our stock screener. This pattern typically occurs when a stock takes a pause after a significant rise, indicating the possibility of a continuation in the trend. While it's impossible to predict with certainty, it might be beneficial to monitor NYSE:NEM.
Technical analysis of NYSE:NEM
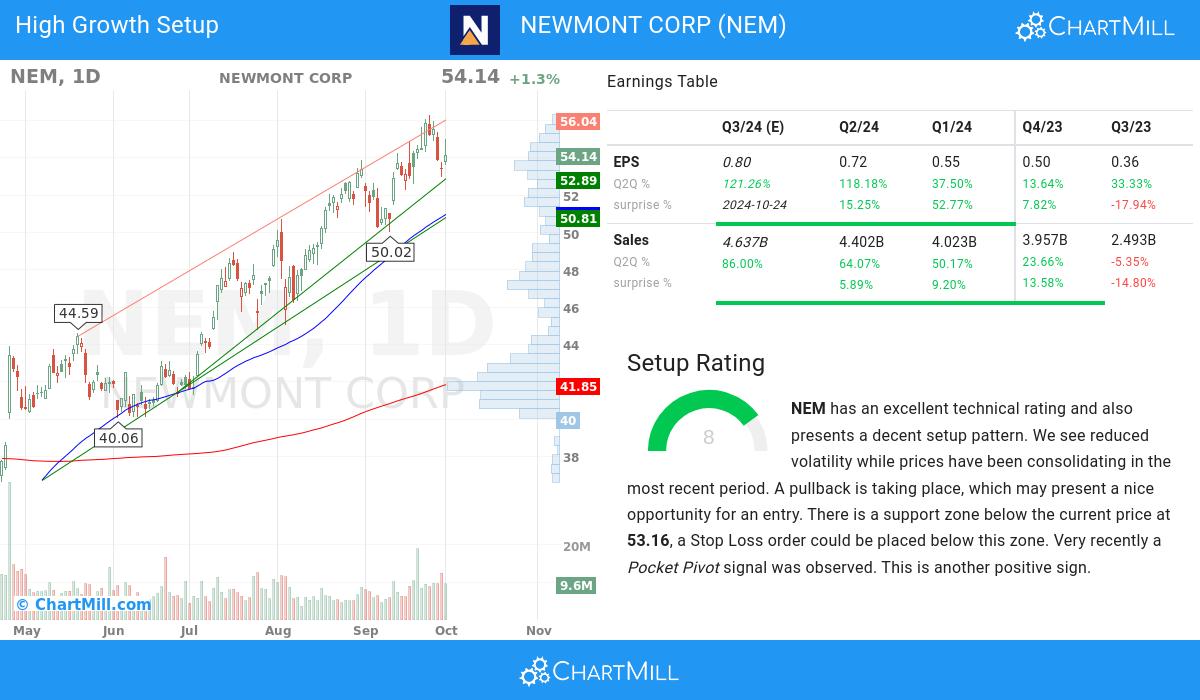
As part of its analysis, ChartMill provides a comprehensive Technical Rating for each stock. This rating, ranging from 0 to 10, is updated on a daily basis and is based on the evaluation of various technical indicators and properties.
Taking everything into account, NEM scores 10 out of 10 in our technical rating. Both in the recent history as in the last year, NEM has proven to be a steady performer, scoring decent points in every aspect analyzed.
- The long and short term trends are both positive. This is looking good!
- When comparing the yearly performance of all stocks, we notice that NEM is one of the better performing stocks in the market, outperforming 87% of all stocks. On top of that, NEM also shows a nice and consistent pattern of rising prices.
- NEM is part of the Metals & Mining industry. There are 157 other stocks in this industry. NEM outperforms 74% of them.
- NEM is currently trading near its 52 week high, which is a good sign. The S&P500 Index however is also trading near new highs, which makes the performance in line with the market.
- In the last month NEM has a been trading in the 50.02 - 56.30 range, which is quite wide. It is currently trading in the middle of this range, so some resistance may be found above.
For an up to date full technical analysis you can check the technical report of NEM
How do we evaluate the setup for NYSE:NEM?
In addition to the Technical Rating, ChartMill provides a Setup Rating for each stock. This rating, ranging from 0 to 10, assesses the level of consolidation in the stock based on multiple short-term technical indicators. Currently, NYSE:NEM has a 8 as its setup rating, indicating its current consolidation status.
NEM has an excellent technical rating and also presents a decent setup pattern. Prices have been consolidating lately and the volatility has been reduced. A pullback is taking place, which may present a nice opportunity for an entry. There is a support zone below the current price at 53.16, a Stop Loss order could be placed below this zone. Another positive sign is the recent Pocket Pivot signal.
Looking into the high growth metrics of NEWMONT CORP
- The recent financial report of NEWMONT CORP demonstrates a 118.0% increase in quarterly earnings compared to the previous quarter. This growth indicates positive momentum in the company's financials and suggests a promising upward trend
- NEWMONT CORP has demonstrated strong q2q revenue growth of 64.07%, suggesting a favorable trend in the company's financials and indicating the potential for continued expansion.
- NEWMONT CORP has achieved significant 1-year revenue growth of 32.86%, signaling its ability to capture market opportunities and drive top-line expansion. This growth indicates the company's effective execution and its potential for continued success.
- NEWMONT CORP has seen a 8.84% change in the average next Quarter EPS Estimate by analysts over the last 3 months, signaling the shifting perception of the company's EPS outlook.
- The recent financial report of NEWMONT CORP demonstrates a 118.0% increase in quarterly earnings compared to the previous quarter. This growth indicates positive momentum in the company's financials and suggests a promising upward trend
- The earnings per share (EPS) growth of NEWMONT CORP are accelerating: the current Q2Q growth of 118.0% is above the previous year Q2Q growth of -28.26%. Earnings momentum and acceleration are key for high growth systems.
- The operating margin of NEWMONT CORP has seen steady growth over the past year, signaling improved profitability. This trend indicates the company's effective cost management and its ability to generate higher returns.
- NEWMONT CORP exhibits a favorable Debt-to-Equity ratio at 0.31. This highlights the company's ability to limit excessive debt levels and maintain a strong equity base, demonstrating its financial stability and risk management practices.
- NEWMONT CORP exhibits a favorable ownership structure, with an institutional shareholder ownership of 69.34%. This signifies a diverse investor base, which can contribute to a more stable and efficient market for the stock.
- NEWMONT CORP has surpassed EPS estimates 3 times in the last 4 quarters, reflecting its strong financial performance and effective management. This trend suggests the company's ability to generate positive earnings surprises and drive shareholder value.
- NEWMONT CORP has exhibited strong Relative Strength(RS) in recent periods, with a current 87.17 rating. This indicates the stock's ability to outperform the broader market and reflects its competitive position. NEWMONT CORP shows promising potential for continued price momentum.
More high growth momentum breakout stocks can be found in our High Growth Momentum Breakout screen.
Keep in mind
This is not investing advice! The article highlights some of the observations at the time of writing, but you should always make your own analysis and invest based on your own insights.
85.14
-0.07 (-0.08%)
Find more stocks in the Stock Screener
NEM Latest News and Analysis


