
Technical analysis often relies on identifying stocks with strong existing momentum that are also forming consolidation patterns, offering good risk-reward entry points. One method for finding these chances combines two specific metrics: the ChartMill Technical Rating, which judges a stock’s general technical condition, and the Setup Quality Rating, which checks for a structured, low-volatility base. Stocks with good scores in both groups often show usable breakout setups with well-marked support and resistance levels.
MEDTRONIC PLC (NYSE:MDT) now shows this method, displaying solid technical features next to a high-quality consolidation pattern. With the wider market showing positive trends in both the short and long term, MDT’s chart structure suggests it may be set for a possible upward move.
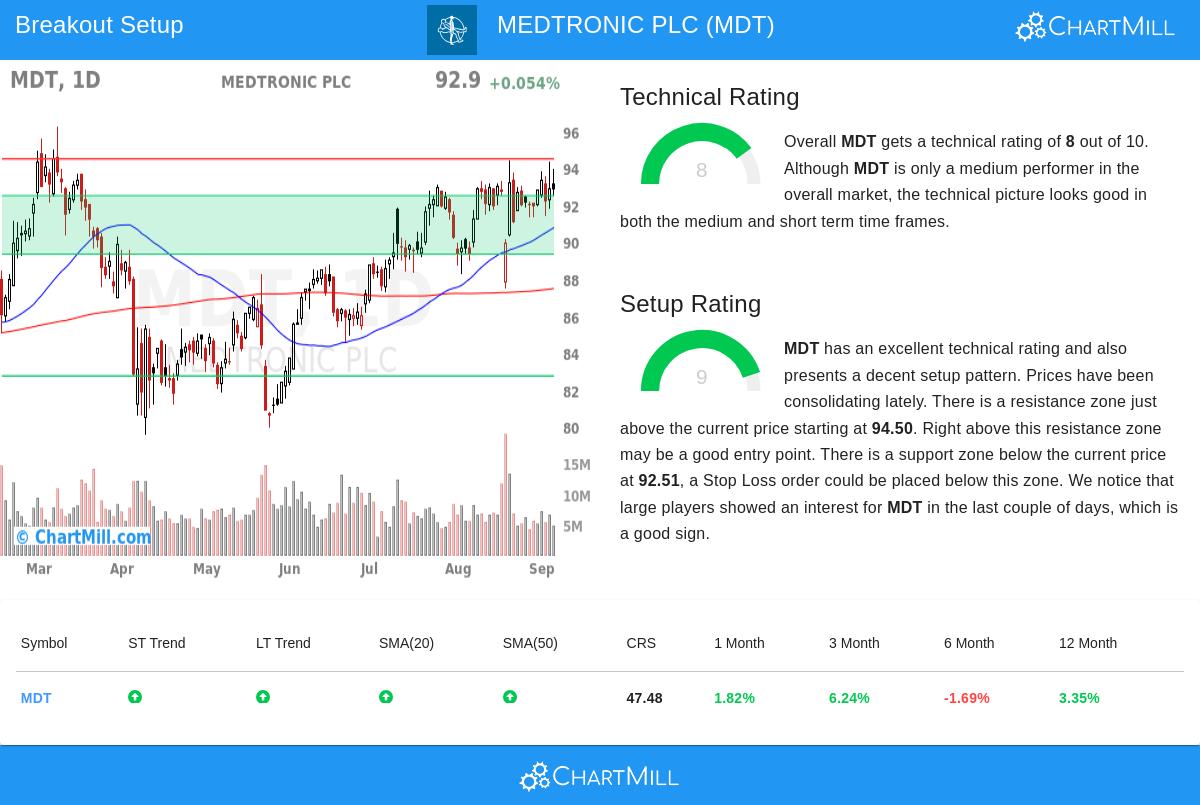
Technical Strength Overview
MDT gets a Technical Rating of 8 out of 10, showing solid bullish momentum across several timeframes. A few things add to this score:
- Both short-term and long-term trends are positive.
- The stock is trading above important moving averages, including the 20-day, 50-day, 100-day, and 200-day SMAs, all of which are rising.
- It is trading in the upper part of its 52-week range, though it is a bit behind the S&P 500, which is near new highs.
This mix of trend strength and moving average agreement points to continued buying interest and gives a good setting for further upward movement. A high Technical Rating is important for breakout plans because it helps find stocks with existing momentum, lowering the chance of false breakouts or failed moves.
Setup Quality and Consolidation Pattern
Maybe more interesting is MDT’s Setup Rating of 9, pointing to a well-made consolidation inside its recent trading range. Important parts of the current setup include:
- Prices have been held between about 87.50 and 94.44 over the last month, showing lower volatility and tighter trading behavior.
- A clear resistance zone is present around 94.50, made by several trendlines and horizontal price levels.
- Strong support is seen near 92.51, helped by a mix of moving averages and trendline support on daily and weekly charts.
This kind of structure allows for a planned entry above resistance with a stop set below support, giving a good risk-to-reward ratio. Also, there are signs of institutional accumulation, as measured by the Effective Volume indicator, adding more belief to the setup.
Trade Structure and Risk Management
Based on the technical structure, an example breakout setup suggests:
- Entry above resistance at 94.51
- Stop loss set at 91.32, below the closest support zone
- This creates a risk of about 3.19 points or 3.38% per share
For position sizing, using 25% of capital for this trade would mean a total portfolio risk of just under 1%, matching careful risk management ideas. It is important to note this structure is an example; traders might change entry and exit levels based on personal plan, time frame, and risk tolerance.
Conclusion
MDT shows a strong case for technical traders looking for breakout chances. Its high Technical Rating confirms existing strength, while its excellent Setup Rating points out a well-marked consolidation pattern with clear levels for entry and exit. As with all technical setups, confirmation of a breakout above resistance is needed, and traders should stay mindful of wider market conditions and company-specific news.
For those wanting to look into more technical breakout ideas, other screened results can be found here.
Disclaimer: This article is for informational purposes only and does not constitute investment advice. The analysis is based on technical metrics and historical price behavior and should not be interpreted as a recommendation to buy or sell any security. Always conduct your own research and consider your financial situation and risk tolerance before trading.