
Peter Lynch’s investment strategy, described in One Up on Wall Street, centers on finding companies with steady growth at fair prices, commonly known as the Growth at a Reasonable Price (GARP) method. The approach highlights fundamental strength, earnings potential, and low debt, steering clear of overly hyped or rapidly expanding firms that might face challenges sustaining their progress. By selecting businesses with solid yet moderate earnings growth, stable financials, and appealing valuations compared to their growth potential, investors can create a varied portfolio aimed at long-term success.
One stock that aligns with this model is LULULEMON ATHLETICA INC (NASDAQ:LULU). The athletic wear retailer matches multiple important factors from Lynch’s strategy, positioning it as a strong option for GARP-focused investors.
Why Lululemon Matches the Peter Lynch Approach
-
Steady Earnings Growth
Lynch preferred firms with reliable, moderate earnings growth, usually between 15% and 30% per year. Lululemon’s five-year EPS growth of 24.37% fits this range, showing healthy but manageable expansion. The company’s capacity to sustain high profitability while growing at this rate points to disciplined management rather than risky, rapid growth. -
Fair Valuation Compared to Growth (PEG Ratio)
A key part of Lynch’s strategy is the PEG ratio (Price/Earnings-to-Growth), which should ideally be under 1 to suggest a stock is priced fairly relative to its growth. Lululemon’s PEG ratio of 0.54, based on its past five-year earnings growth, indicates the stock is trading below its historical growth rate, a favorable signal for value-focused investors. -
High Profitability Measures
Return on Equity (ROE) shows how well a company generates profits from shareholder investments. Lululemon’s ROE of 42.14% is outstanding, surpassing 96% of competitors in the apparel industry. Its Return on Invested Capital (ROIC) of 30.39% further confirms its efficient use of capital. -
Sound Financial Position
Lynch favored companies with little to no debt to minimize risk. Lululemon has no long-term debt, resulting in a Debt/Equity ratio of 0, matching Lynch’s preference for financially secure firms. The company also holds a strong Current Ratio of 2.28, showing it can easily meet short-term obligations. -
Reliable Cash Flow and Margins
Lululemon’s operating cash flow has stayed positive over the past five years, and its profit margin (16.82%) ranks in the top 2% of its sector. These figures reflect strong pricing control and operational effectiveness, traits Lynch linked to lasting competitive edges.
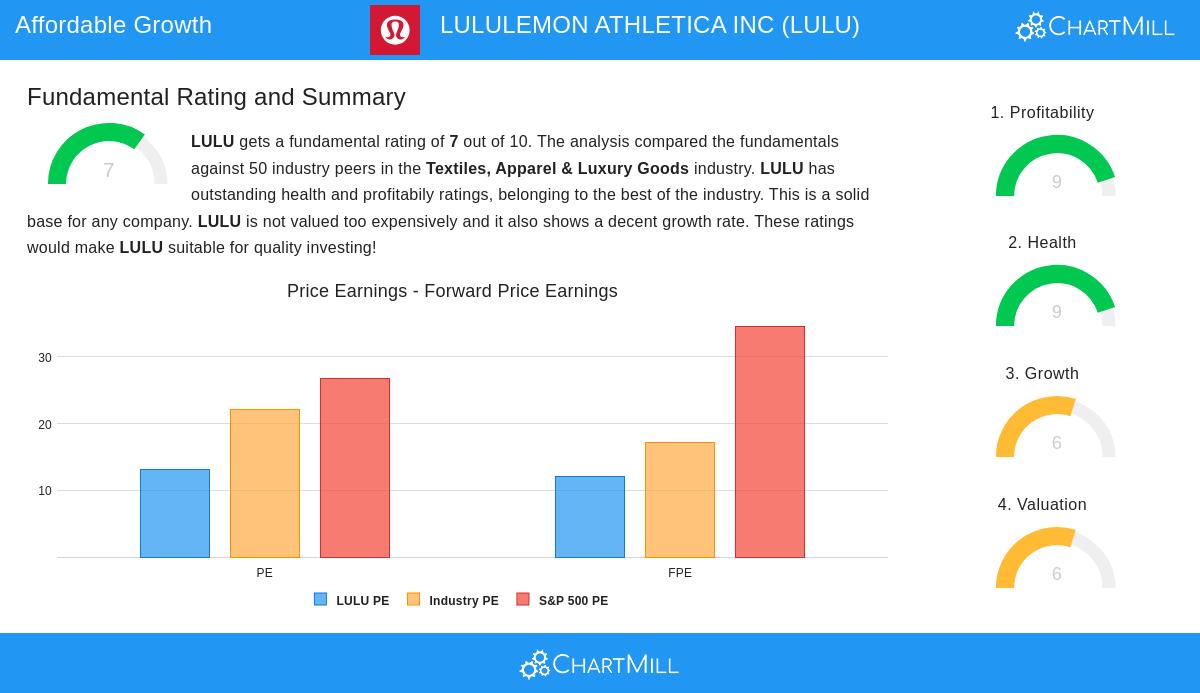
Fundamental Review Summary
Our fundamental report gives Lululemon a score of 7 out of 10, emphasizing its strengths in profitability and financial stability. While its valuation seems reasonable next to industry peers and the broader market, the report mentions a slight dip in expected revenue growth, a factor investors should watch. Still, the company’s high ROE, strong margins, and debt-free status make it a solid choice for long-term growth.
Discovering More Peter Lynch Strategy Picks
For investors looking for additional stocks that fit Lynch’s GARP principles, our Peter Lynch Strategy screen offers a selected list of companies meeting these standards.
Disclaimer: This article is for informational purposes only and does not constitute investment advice. Investors should conduct their own research or consult a financial advisor before making decisions.