
For investors aiming to use the momentum of high-performing companies, a mixed technical and fundamental method can be a strong strategy. The aim is to find stocks that show both solid underlying business growth and are set for a possible price breakout. This process sorts for companies with sound fundamental health and earnings, making sure the growth can last, while also looking for positive chart patterns that indicate a technical catalyst could be close. The meeting of these two analytical fields seeks to find chances where solid business performance is about to be acknowledged and shown in the stock price.
Eli Lilly & Co (NYSE:LLY) is notable as a top candidate found by this sort of screening. The pharmaceutical leader has become a central point in the market, pushed by the outstanding commercial performance of its new wave of treatments, especially in diabetes and obesity care. The company's fundamental narrative is one of rapid growth, which seems to be matching a positive technical arrangement on its stock chart.
Fundamental Growth Driver
At its heart, the investment case for Eli Lilly depends on its notable and speeding financial results. A look at the company's fundamental analysis report shows a stellar growth outline that is key to the screening plan. The company's Growth Rating is a solid 8 out of 10, backed by impressive recent numbers and positive future estimates.
- Rapid Recent Growth: In the last year, Lilly reported a 116% rise in Earnings Per Share (EPS) and a 45% increase in Revenue, numbers that are much higher than usual pharmaceutical industry standards.
- Speeding Path: Importantly, this growth speed is increasing. Experts estimate that EPS growth will average 32.6% each year in the next few years, up from the already good 16.6% average of the past several years. This increase is a key quality sign for a genuine growth stock, showing wider market use and operational efficiency.
- Earnings to Back the Narrative: This growth is very profitable. Lilly gets a top-level Profitability Rating of 9, with industry-best margins. Its Return on Invested Capital (ROIC) of 28.8% is much higher than its cost of capital, proving that growth is making real value for shareholders, a required standard for lasting growth investing.
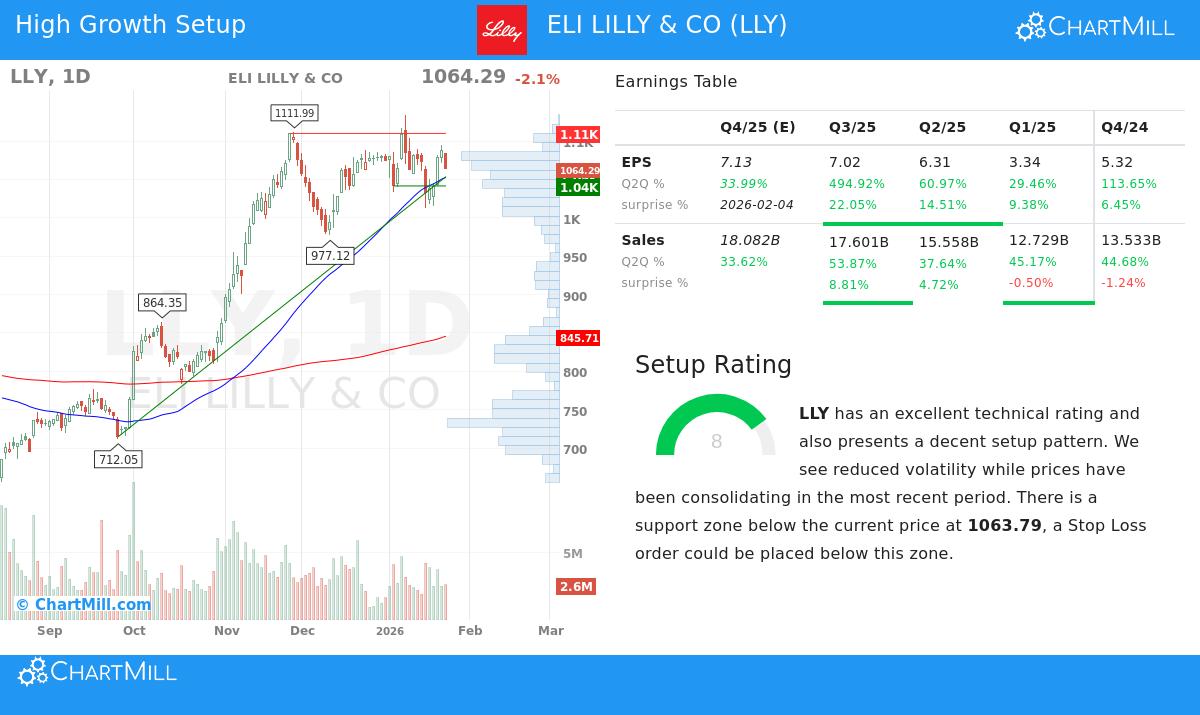
Technical Breakout Chance
While fundamentals explain the "why," technical analysis aids in spotting the "when." Lilly's stock has performed well, but the present chart formation indicates a time of pause that might come before its next rise. The stock's technical analysis report gives a high rating of 9, with a Setup Rating of 8, showing a positive pattern is active.
- Solid Basic Trend: Both the long-term and short-term trends for LLY are rated as good, giving a positive setting. The stock is priced above its important rising moving averages (50-day, 100-day, and 200-day).
- Pause Inside a Band: Lately, the stock has been trading inside a set band between about $1,012 and $1,133. After a big rise, this pause is a normal process that can gather force for a following move.
- Main Resistance Watched: The technical arrangement points to a clear resistance area between $1,070 and $1,080, made by meeting moving averages and earlier price moves. A clear move above this area might mark the close of the pause stage and the start of a new rising trend, giving a possible technical entry point for momentum investors.
Price and Points to Think About
Expectedly for a firm with such a strong growth story, standard price measures seem high. The stock sells at a high level based on its Price-to-Earnings ratio. But, this is viewed next to its unusual growth rate. The screening system focuses on solid growth and earnings over low price, knowing that high growth often gets a high price. The price score of 5 is middle, showing this balance. Investors need to balance the high current price against the chance for continued unusual earnings growth.
A Meeting Chance
Eli Lilly shows a strong case where a solid fundamental growth story meets a positive technical chart formation. The company’s lead in changing healthcare markets gives the earnings momentum that growth investors want. At the same time, the stock's technical position, marked by a solid main trend and a tightening pattern near resistance, indicates this fundamental strength might be close to starting a new period of price gains. This match is exactly what the mixed screening plan is made to find.
For investors wanting to see other stocks that fit these standards of solid growth combined with hopeful technical arrangements, you can see the full screen results here.
Disclaimer: This article is for information only and is not financial advice, a suggestion, or a deal to buy or sell any securities. Investing has risk, including the possible loss of the original amount. Always do your own study and think about your money situation and risk comfort before making any investment choices.