
For investors looking to join solid fundamental growth with good technical entry points, a multi-layered screening method can be especially effective. One useful technique includes sorting for stocks that show forceful earnings momentum, a key trait of the CANSLIM and Minervini investing methods, while also showing orderly price patterns. This can be done by searching for securities with a high ChartMill High Growth Momentum (HGM) Rating, which measures short-term earnings speed and good revisions, together with high Technical (TA) and Setup Ratings, which indicate a good uptrend and a forming price pattern ready for a possible breakout. Eli Lilly & Co (NYSE:LLY) appears as a leading case from such a search, showing the combination between strong fundamental results and a technically good chart.
Fundamental Growth Momentum
Eli Lilly’s fundamental picture is a clear example of high growth momentum, receiving a firm HGM Rating of 7. The company is experiencing a notable earnings increase, powered mainly by its very successful GLP-1 drugs for diabetes and weight loss. This momentum is visible in several important measures that the HGM Rating aims to find:
- Forceful Earnings Growth: The latest quarter reported earnings per share (EPS) rising by nearly 495% against the same time last year. This comes after a trailing twelve-month (TTM) EPS growth of more than 116%.
- Solid and Speeding Sales: Revenue growth stays very forceful, with the last quarter up 53.9% year-over-year. The company has provided steady top-line growth, with the three previous quarters also showing rises above 37%.
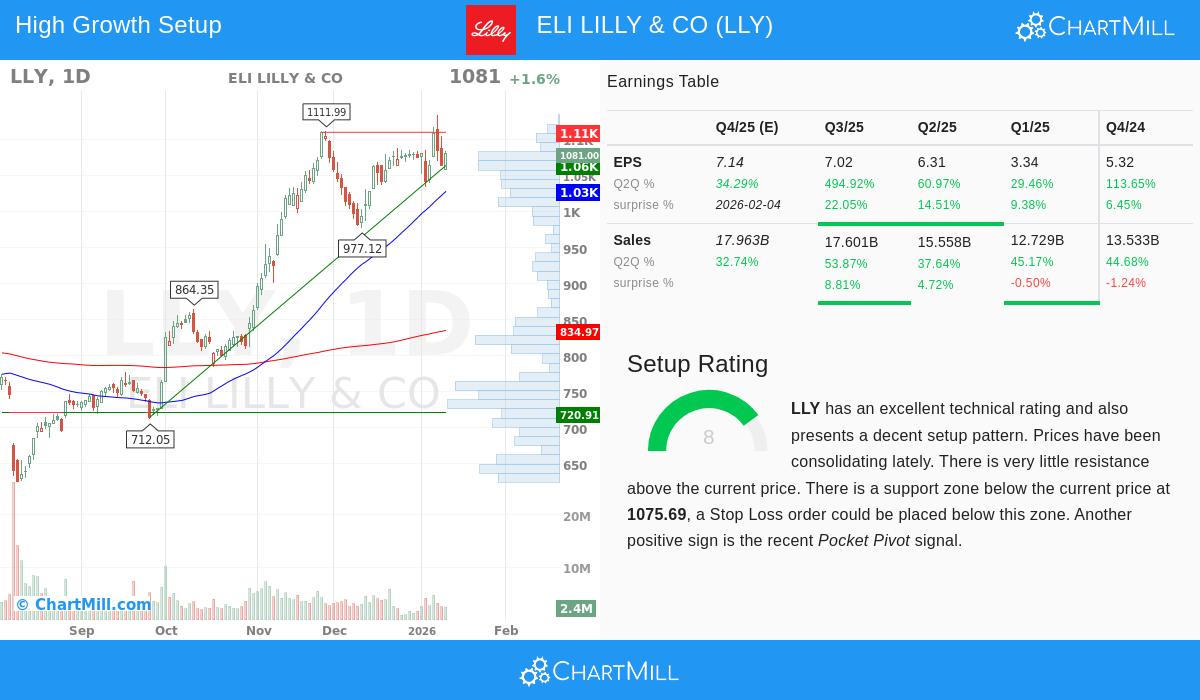
- Good Surprises and Revisions: Lilly has exceeded EPS estimates in each of the last four quarters, with an average surprise of 13.1%. Also, analysts have been increasing their estimates, with the average EPS forecast for the next year adjusted upward by 4.8% over the last three months, a main sign of continued momentum.
- Margin Improvement: The company's profitability is growing with its sales. The profit margin in the last reported full year was 23.5%, a notable improvement from 15.4% in the year before, showing operating leverage.
This mix of speeding sales, rising earnings, steady good surprises, and upward analyst revisions is exactly what the High Growth Momentum Rating tries to spot, making Lilly a strong candidate for growth-oriented plans.
Technical Strength and Trend
While fundamental momentum is key, the timing of an entry is often guided by the chart. According to the detailed ChartMill Technical Report, Eli Lilly has a perfect Technical Rating of 10 out of 10. This high score shows a stock in a forceful and steady uptrend across all time periods.
- Trend Condition: Both the short-term and long-term trends are rated as good. The stock is trading well above its main moving averages (20, 50, 100, and 200-day), all of which are increasing, a clear sign of lasting bullish momentum.
- Market Outperformance: Lilly’s results are much better than the wider market, showing better yearly performance than 91% of all stocks and placing in the top group of its pharmaceuticals industry.
- Formation Within a Trend: After a forceful rise, the stock has started a time of formation over the past month, trading between about $1,003 and $1,134. This pause inside a strong uptrade is a good development, letting the stock absorb its gains.
High-Quality Setup Pattern
A strong trend by itself does not always offer a low-risk entry point. This is where the Setup Rating becomes important. Lilly’s Setup Rating of 8 shows the recent formation has made an orderly pattern.
- The technical report states that "prices have been consolidating lately" in the middle of its recent range, which may offer a good entry chance.
- There is "very little resistance above the current price," suggesting a clean path higher if the stock can break out from its formation.
- A clear support zone exists below the current price, around $1,075, giving a sensible area to set a protective stop-loss order.
- A recent "Pocket Pivot" signal, a price move up on higher volume than the worst down volume of the prior 10 days, was also seen, adding a good volume confirmation to the setup.
This meeting of a strong basic trend (TA Rating 10) and a tight, clear formation with defined support (Setup Rating 8) creates the kind of technical breakout setup that trend-following investors look for.
Conclusion
Eli Lilly & Co offers a strong case for investors using a high-growth momentum plan with a focus on technical timing. The company’s fundamental engine is working very well, shown by its HGM Rating of 7 and measures displaying forceful earnings growth, solid sales speed, and good analyst feeling. This fundamental strength is matched in a technically clean chart, marked by a leading uptrend (TA Rating 10) and a current price formation that gives a defined, lower-risk entry setup (Setup Rating 8). For investors, this match indicates a stock with both the fundamental push for continued growth and the technical position for a possible continuation of its upward move.
Discover More High-Growth Setups This study of LLY came from a specific search for stocks with solid growth momentum and good technical setups. You can see current results from this screening method by visiting the High Growth Momentum Breakout Setups Screen.
Disclaimer: This article is for information only and does not form investment advice, a suggestion, or an offer to buy or sell any security. The study is based on given data and shows the author's view. Investors should do their own research and think about their personal money situation and risk tolerance before making any investment choices. Past results are not a guide for future results.