
A method that mixes basic soundness with chart-based timing looks for firms with solid core business results that are also near a possible price advance. This technique tries to seize the impulse of a stock as it starts a fresh rising phase, supported by the belief that the firm's financial condition and growth path can maintain the movement. By sorting for stocks with good growth basics, acceptable earnings, and firm financial standing, investors first create a base of caliber. Adding a chart study that spots periods of sideways movement and possible advance points offers a strategic point to enter, trying to match the buy with the start of a new step up in the stock's price path.
Eli Lilly & Co (NYSE:LLY) appears as a leading pick from a filter made to locate such chances. The drug maker shows the forceful basic growth that is the base of this method, while its recent price movement hints at a chart formation that might come before a notable move.
Basic Growth Driver
The heart of this investment idea depends on Eli Lilly's outstanding basic results, especially its growth measures. The company's basic analysis report gives it a high-level Growth Score of 9 out of 10, pointing to results that greatly exceed others in its field. This score is key for the method, as continued profit and sales increases are the main forces behind long-term stock gains for growth-focused firms.
Important growth points from the report are:
- Forceful Recent Growth: Earnings Per Share (EPS) rose by 86.23% over the last year, while sales increased by a notable 44.70%.
- Good Historical Path: The firm has kept an average yearly EPS increase of 25.01% and sales growth of 21.58% over recent years.
- Firm Future View: Experts forecast continued good growth, with expected average yearly EPS increase of 20.51% and sales growth of 14.96% going ahead.
This steady and forceful growth across past, current, and coming times gives a firm base, meeting the quality condition of having a big and increasing target market, in Lilly's situation, pushed by top-selling drugs in diabetes and weight care.
Earnings and Financial Standing
Beyond only growth, the method needs "acceptable earnings and health" to make sure the firm is effectively turning sales into profits and can fund its increase. Eli Lilly does well here too, getting an Earnings Score of 9/10. Its profit levels are with the best in the drug industry, with an Earnings Margin of 31.66% and a Business Margin of 45.56%. High return measures like a Return on Equity of 77.78% further highlight the firm's outstanding operational effectiveness.
The Financial Health Score of 6/10 shows a more varied situation, which is a key detail for investors to note.
- Strong Points: The firm has a very good Altman-Z score (8.61), showing low failure risk, and has been lowering its share count.
- Points to Note: The report mentions a high Debt/Equity level (1.54) and lower cash ratios compared to field peers. While the debt amount is high, it is now being handled well, as shown by the good earnings and growth. For a growth stock in a field needing much capital, some debt can be okay if used well, which Lilly has clearly done.
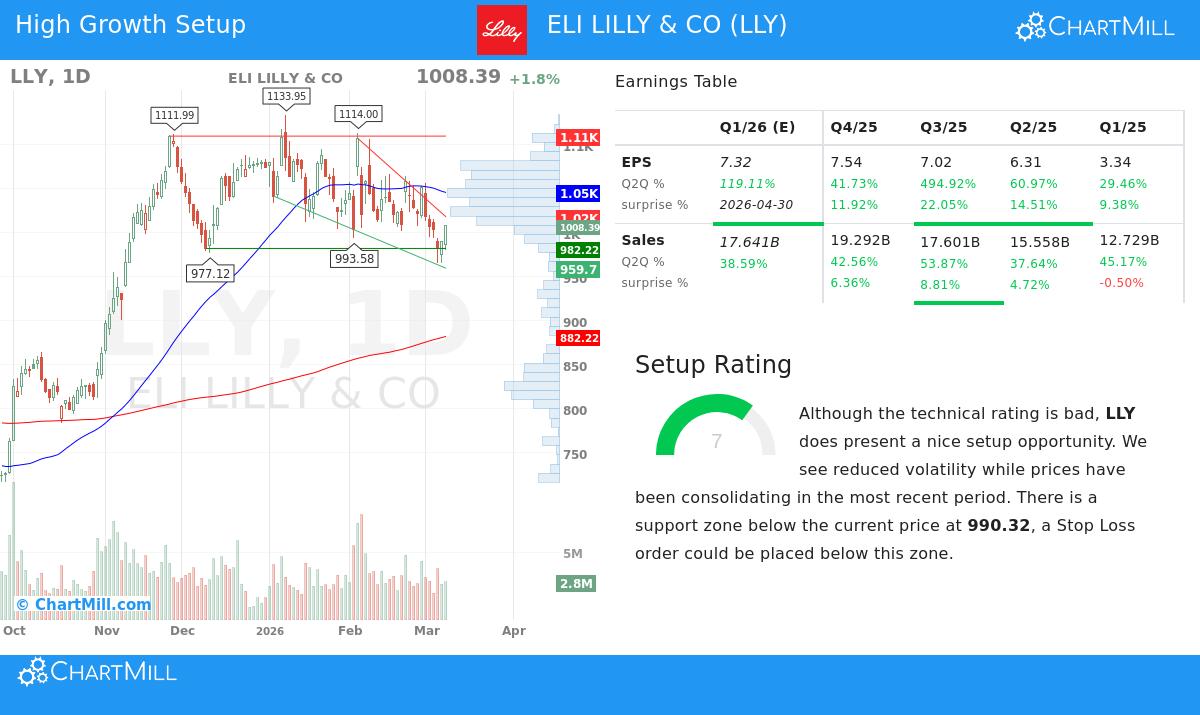
Chart Formation for a Possible Advance
The basic soundness sets the scene, but the chart study gives the possible timing signal. Per the chart analysis report, Eli Lilly shows a "good formation chance" with a Formation Score of 7 out of 10, even with a lower total chart score due to recent sideways movement.
The formation is marked by:
- Sideways Movement in a Band: Over the last month, the stock has moved within a wide band ($965.60 - $1,106.94) and is now trading near the lower part of this band.
- Clear Support Area: A key support zone has been found between $982.22 and $990.32, made by several price lines. This gives a set level where buy interest may rise.
- Lowered Price Swings: The report notes lowered price swings during this time of sideways movement, which can often come before a clear price move.
This pattern fits with the method's aim of finding chart advance formations. The stock is absorbing its large earlier gains and forming a base. A rise from the found support zone on high trade amount could signal the beginning of a new rising phase, offering a strategic entry point matched with the forceful basic story.
Price Context
With a Price Score of 5/10, Eli Lilly is in a middle area. Its Price-to-Earnings (P/E) level of 41.65 is high compared to the wider S&P 500 but is actually priced lower than most of its drug field peers. More importantly, when growth is included via the PEG level, the price seems more fair, making up for the firm's outstanding profit increase. For growth investors, paying a high price for a shown, speeding growth path is often part of the plan.
Summary
Eli Lilly & Co shows the kind of firm a mixed basic and chart filter aims to find. It has a leading, speeding growth picture backed by top-level earnings, meeting all the basic points for a good growth stock. At the same time, its price movement displays a sideways formation with a clear support level, presenting a clear chart formation for a possible advance. This combination hints the stock may be set for its next step up, supported by both its business impulse and its price structure.
This study is based on basic and chart data reports and is for information only. It is not advice to buy, sell, or keep any security. All investments have risk, including the possible loss of the amount invested. Investors should do their own study and think about their personal money situation before making any investment choices.
Looking to find more stocks that mix good growth with hopeful chart formations? You can use the same filter with our stock filter tool.