
Eli Lilly & Co (NYSE:LLY) has become a noteworthy option for investors using a high growth momentum plan joined with technical breakout review. This method finds companies showing solid earnings momentum and speeding up growth basics while also displaying positive technical chart formations that indicate possible short-term price gains. By filtering for stocks with high scores in growth momentum, technical condition, and setup quality measures, investors can identify securities set for ongoing positive performance.
Growth Momentum Basics
Eli Lilly shows notable growth traits that match high momentum investment rules. The company's earnings results display significant speeding up over several periods, a main element in the High Growth Momentum Rating method that assesses both past results and future growth outlook.
-
EPS Growth Measures:
- Trailing twelve-month EPS growth: 77.7%
- Most recent quarterly EPS growth: 61.0% year-over-year
- Next quarter estimated EPS growth: 406.1% year-over-year
-
Revenue Increase:
- TTM revenue growth: 36.8%
- Recent quarterly sales growth: 37.6%
- Next quarter estimated sales growth: 41.4%
The company has displayed outstanding regularity in surpassing earnings projections, beating EPS forecasts in three of the last four quarters by a typical 2.5%. Analyst view stays positive, with next-year EPS forecasts adjusted higher by 3.8% over the past three months, showing increasing belief in the company's growth path. These basic strong points add meaningfully to Eli Lilly's High Growth Momentum Rating of 6, putting it notably above the lowest limit for review in growth momentum plans.
Technical Condition Evaluation
Eli Lilly's technical picture shows notable condition, receiving a Technical Rating of 8 out of 10. This rating reviews several parts including relative condition, trend course, and moving average arrangement over different periods.
Trend Review:
- Both extended and short-term trends are positive
- Trading above all main moving averages (20-day, 50-day, 100-day, and 200-day)
- All moving averages are increasing, confirming the positive trend formation
Market Placement:
- Relative strength percentile: 48% (performing similarly to wider market)
- Industry standing: doing better than 56% of pharmaceutical sector counterparts
- Recent trading span: $725.31, $864.35, presently placed in the middle of this span
The stock's technical condition is further backed by solid volume traits, with a typical daily volume of 3.54 million shares providing sufficient liquidity for large-scale participation. For a full technical examination, see the complete technical analysis report.
Setup Quality and Trading Activity
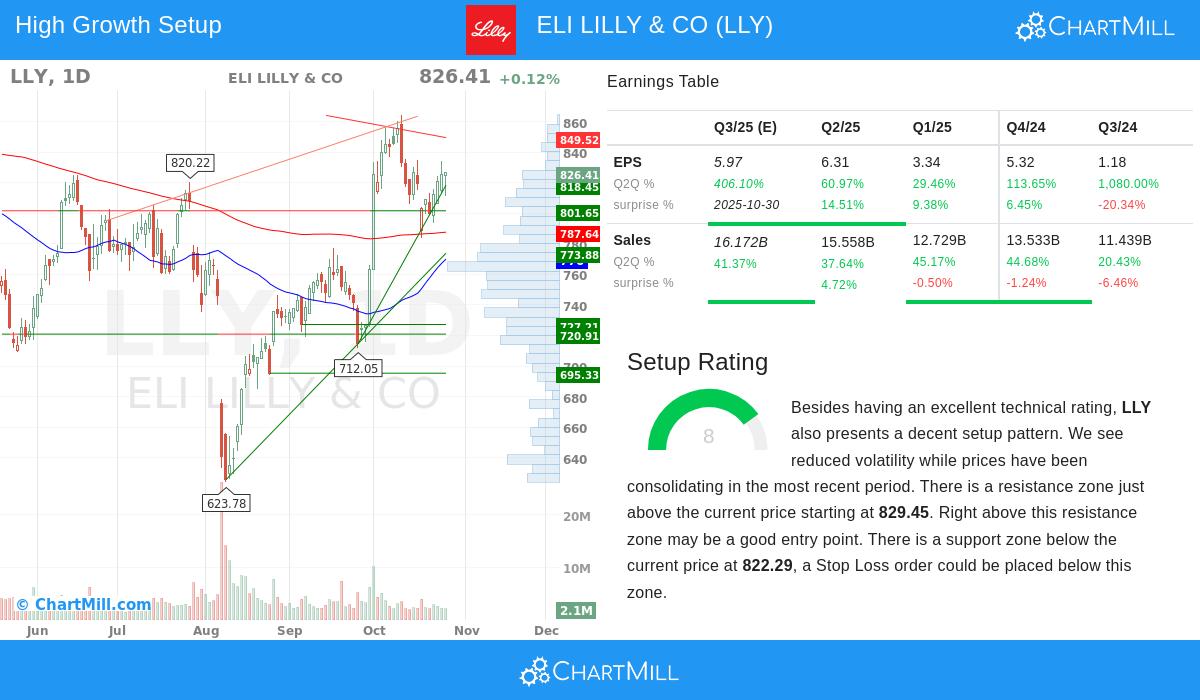
Eli Lilly shows a positive setup formation with a Setup Rating of 8, indicating the stock is settling within a set span and could be getting ready for its next price move. The setup quality measure reviews consolidation formations, nearness to moving averages, and the existence of clear support and resistance points.
Consolidation Traits:
- Recent price movement shows lower instability and side-to-side action
- Present consolidation gives possible entry point within set span
- Clear resistance area noted between $829.45 and $867.61
- Multiple support points below present price, with main support at $822.29
Possible Trading Plan:
- Proposed entry: $834.71 (above recent resistance)
- Proposed stop loss: $815.49 (below support area)
- Risk/reward outline: 2.30% possible risk on trade
- Position size suggestion: 25% of capital for 0.58% portfolio risk
The setup displays a positive technical arrangement where a breakout above resistance could point to the next upward move, while well-set support points give clear risk management limits. This mix of technical condition and consolidation formation makes Eli Lilly especially interesting for breakout-focused plans.
Investment Points
Eli Lilly's mix of solid basic growth momentum and positive technical placement creates a noteworthy case for investors following growth momentum methods. The company's extraordinary earnings growth, especially in forward estimates, matches the CANSLIM method that highlights earnings speeding up and positive forecast adjustments. At the same time, the technical setup gives a set risk structure for possible entry.
The pharmaceutical leader's varied product group, including successful treatments in cardiometabolic health, cancer, and brain science, provides several growth sources. Recent progress in their product line, especially in weight loss and diabetes drugs, has added to the solid growth measures and positive analyst view.
For investors looking for similar options that join solid growth basics with positive technical setups, more filtering results can be found using the High Growth Momentum Breakout Setups screen. This filtering method keeps finding companies displaying the traits liked by growth momentum investors while showing technically sound entry options.
Disclaimer: This examination is for information purposes only and does not make up investment guidance, suggestion, or backing of any security or plan. Investors should do their own investigation and talk with financial consultants before making investment choices. Past results do not assure future outcomes, and all investments have risk including possible loss of original investment.