
JPMORGAN CHASE & CO (NYSE:JPM) Shows Strong Technical Breakout Potential
By Mill Chart
Last update: Aug 23, 2025
JPMORGAN CHASE & CO (NYSE:JPM) has appeared in a technical breakout screen made to find stocks with solid momentum and good entry conditions. This method uses two specific metrics: the ChartMill Technical Rating, which measures the general condition and trend quality of a stock, and the ChartMill Setup Quality Rating, which examines the consolidation pattern to find the best entry points. The aim is to locate securities that are not only in a good uptrend but also show tight, low-volatility trading ranges, hinting at a potential breakout.
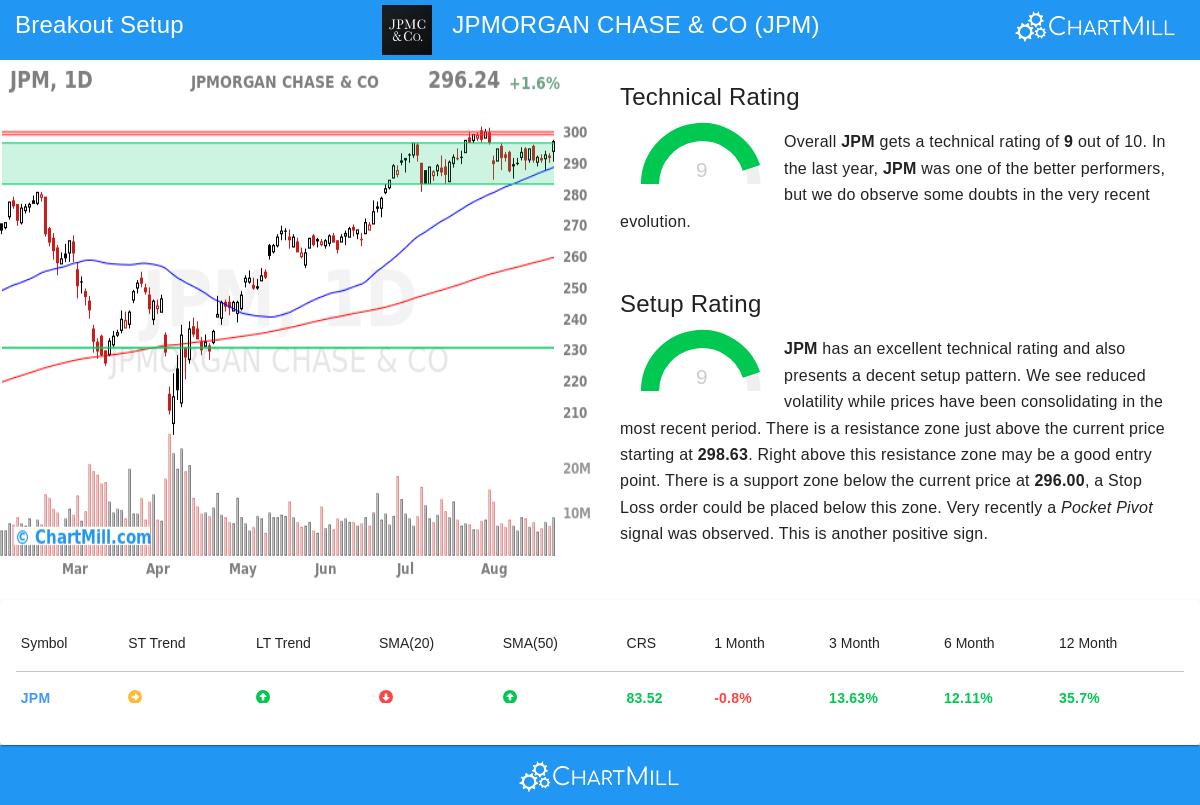
Technical Strength and Trend Analysis JPMorgan shows very good technical strength, receiving a Technical Rating of 9 out of 10. This high number shows its steady performance across different periods and its standing compared to important moving averages. The long-term trend stays positive, and the stock is trading close to its 52-week high, doing better than 83% of all stocks in the market over the last year. In the banking industry, it is in the top 14%, showing clear relative strength. This kind of solid technical condition is important for breakout strategies because it shows the stock is in a verified uptrend, making false breakouts less likely and offering a better chance for continued upward movement.
Setup Quality and Consolidation Pattern Also important, JPMorgan has a Setup Rating of 9, pointing to a high-quality consolidation pattern. Recent trading has been contained within a range between about $284 and $301, with lower volatility and prices settling near the middle of this area. This kind of price activity frequently comes before a big move, as it shows a time of balance between buyers and sellers before one side takes control. The setup is made stronger by a recent pocket pivot signal, a volume-backed accumulation pattern, adding to the confidence in the possible breakout. For technical investors, a high setup score like this is key because it finds a clear support level under the current price (around $296) and a specific resistance zone just above (starting near $298.63), allowing for exact entry and stop-loss placement.
Trade Setup and Risk Considerations Based on the analysis, a possible breakout entry is proposed above $299.65, with a stop-loss just under $287.15. This controls the worst-case risk to about 4.17% of the trade value. It is important to remember that while the automated setup gives a structured method, traders should always do their own research, particularly concerning upcoming earnings or macroeconomic events that could affect the banking sector.
For those wanting to look into similar technical breakout chances, more results can be found using the Technical Breakout Setups Screen.
Disclaimer: This analysis is for informational purposes only and does not constitute investment advice. Trading securities involves risk, and individuals should conduct their own research or consult a financial advisor before making investment decisions.
