
ROBINHOOD MARKETS INC - A (NASDAQ:HOOD) – A High-Growth Momentum Stock Meeting Minervini’s Trend Template
By Mill Chart
Last update: Jun 2, 2025
ROBINHOOD MARKETS INC - A (NASDAQ:HOOD) has been identified by our stock screener as a high-growth momentum candidate that also satisfies Mark Minervini’s Trend Template criteria. The stock exhibits strong technical trends alongside accelerating fundamentals, making it a potential candidate for growth-focused investors.
Why HOOD Fits the Minervini Trend Template
Minervini’s strategy focuses on stocks in strong uptrends with improving fundamentals. HOOD meets the following key technical criteria:
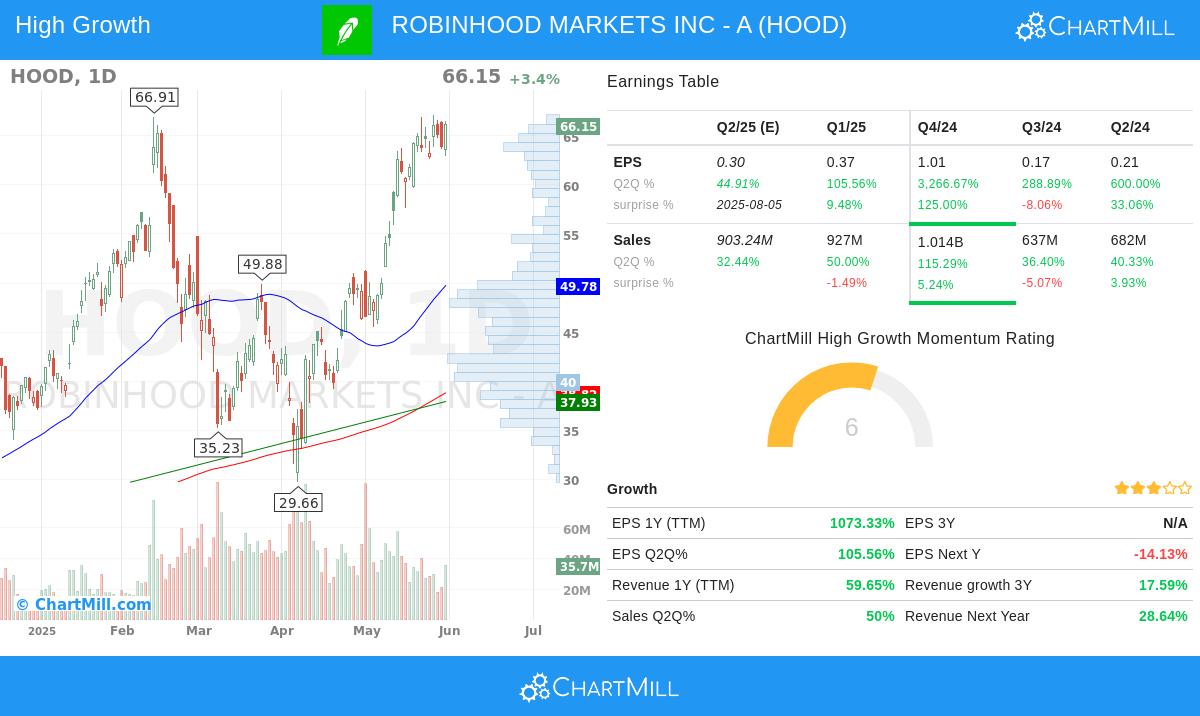
- Price Above Key Moving Averages: The stock trades at $66.15, well above its 50-day ($49.78), 150-day ($44.31), and 200-day ($38.82) moving averages.
- Upward-Sloping Averages: The 50-day, 150-day, and 200-day MAs are all trending higher, confirming sustained momentum.
- Relative Strength: With a ChartMill Relative Strength (CRS) score of 98.49, HOOD outperforms nearly 99% of stocks in its sector.
- Price Near 52-Week High: At $66.15, HOOD is within 1.5% of its 52-week high ($67.13), a sign of leadership.
- Strong Long-Term Trend: The stock has gained over 216% in the past year, demonstrating powerful upward momentum.
High-Growth Fundamentals
Beyond technical strength, HOOD shows explosive growth in key financial metrics:
- Earnings Growth: EPS (TTM) surged 1,073% YoY, while quarterly EPS growth accelerated by 105.6% in the most recent quarter.
- Revenue Expansion: Revenue grew 59.6% over the past year, with quarterly sales up 50% YoY.
- Profitability Improvement: The company’s profit margin expanded to 36.2% in the latest quarter, up from negative figures in prior years.
- Free Cash Flow Growth: FCF per share increased by 310% YoY, reflecting strong operational efficiency.
Technical Outlook
According to ChartMill’s technical report, HOOD scores a perfect 10/10 on technical health, supported by:
- A strong uptrend in both short-term and long-term timeframes.
- Support levels at $63.17 and $37.93-$38.31, providing downside protection.
- Resistance near $66.16, which, if broken, could signal further upside.
While the setup rating is currently 4/10 due to recent volatility, the stock’s technical strength and growth profile make it one to watch for potential consolidation and breakout opportunities.
For a deeper technical analysis, review the full ChartMill technical report on HOOD.
Our High Growth Momentum + Trend Template screener lists more high-growth stocks with strong technical setups.
Disclaimer
This is not investment advice. The observations here are based on current data, but investors should conduct their own analysis before making decisions.
113.1
-2.35 (-2.04%)
Find more stocks in the Stock Screener
HOOD Latest News and Analysis


