
In value investing, the search for undervalued stocks often involves a disciplined screening process that balances attractive valuation with solid underlying fundamentals. One such approach is the "Decent Value" screen, which identifies companies with strong valuation metrics, typically a ChartMill Valuation Rating above 7, while maintaining reasonable scores in profitability, financial health, and growth. This strategy aligns with the core principles of value investing, where investors seek securities trading below their intrinsic value but backed by operational strength and stability, reducing the risk of value traps. The goal is to find opportunities where the market may have overlooked a company’s true worth, offering a potential margin of safety for long-term investors.
GAP INC/THE (NYSE:GAP), a well-known global apparel retailer with brands like Gap, Old Navy, Banana Republic, and Athleta, recently emerged from such a screen. With a ChartMill Fundamental Rating of 6 out of 10, it stands out in the specialty retail industry for its combination of undervaluation and respectable fundamentals, making it a candidate worthy of deeper analysis for value-oriented portfolios.
Valuation Metrics
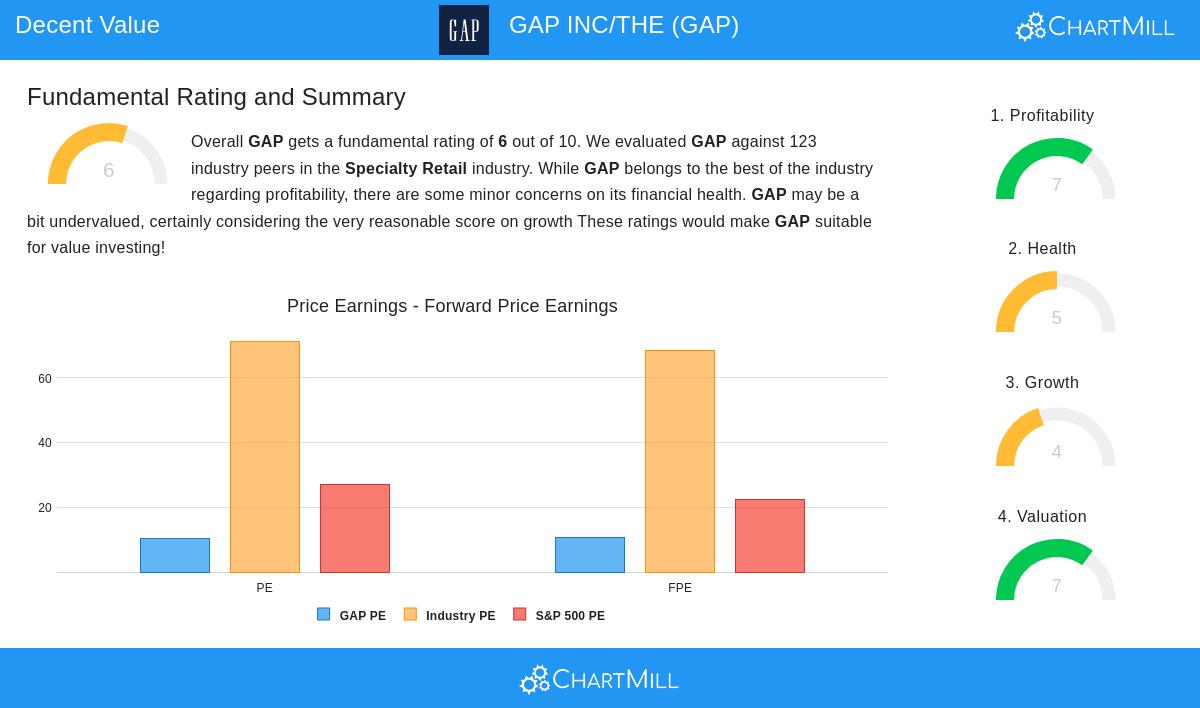
The valuation picture for GAP is particularly strong, earning a score of 7 in this category. Key metrics indicate that the stock is priced conservatively relative to both its industry and broader market benchmarks:
- Price-to-Earnings (P/E) Ratio: At 10.29, it is significantly lower than the industry average of 71.31 and the S&P 500’s 27.03, suggesting the market may be undervaluing its earnings capacity.
- Forward P/E Ratio: 10.55, which remains attractive compared to industry and S&P 500 averages, reinforcing the view that future earnings are not fully priced in.
- Enterprise Value to EBITDA: This ratio places GAP cheaper than 91.87% of its industry peers, highlighting a potential discount to its cash flow generation.
For value investors, these metrics are critical, they signal a stock that may be trading below its intrinsic value, providing that essential margin of safety Benjamin Graham emphasized. When a company shows such valuation strengths without glaring fundamental weaknesses, it often represents a calculated opportunity rather than a speculative gamble.
Profitability Assessment
GAP’s profitability is a notable bright spot, with a rating of 7. The company demonstrates strong efficiency and margin performance:
- Return on Equity (ROE): At 25.90%, it outperforms 84.55% of industry peers, indicating effective use of shareholder capital.
- Profit Margin: 5.86%, ranking in the top tier of the specialty retail sector, and margins have shown improvement in recent years.
- Operating and Gross Margins: Both have trended upward, reflecting operational enhancements and cost management.
Profitability is a cornerstone of value investing because it validates a company’s ability to generate returns and sustain itself without excessive risk. High ROE and improving margins suggest that GAP is not just cheap but also fundamentally sound, reducing the likelihood that its low valuation stems from irreversible decline.
Financial Health
With a health rating of 5, GAP’s financial position is adequate, though with some nuances:
- Debt Levels: A debt-to-equity ratio of 0.43 indicates moderate leverage, and the company’s debt-to-free-cash-flow ratio of 1.94 is excellent, showing it can cover obligations quickly.
- Liquidity: The current ratio of 1.68 is solid, though the quick ratio of 0.96 suggests some short-term liquidity constraints, common in retail due to inventory cycles.
- Solvency: An Altman-Z score of 2.78, while not stellar, does not signal immediate distress and is better than many peers.
Financial health is vital for value investors, it ensures that a company can weather economic downturns and avoid the value traps that often accompany high debt or poor liquidity. GAP’s manageable debt and reasonable liquidity provide a buffer, supporting the thesis that its undervaluation may be temporary rather than symptomatic of deeper issues.
Growth Prospects
Growth is the area where GAP shows more moderation, with a rating of 4. The mixed historical trends are countered by encouraging forward-looking indicators:
- Earnings Per Share (EPS): Increased 15.27% over the past year, and analysts project average annual growth of 5.43% going forward.
- Revenue: While slightly down historically, future revenue is expected to grow at 1.65% annually, with trends indicating acceleration.
For value strategies, growth is not the primary driver, but its presence helps ensure that intrinsic value may expand over time. GAP’s positive EPS trajectory and anticipated top-line growth suggest it is not stagnant, adding a layer of potential catalyst to the undervaluation narrative.
Conclusion
GAP INC/THE presents a strong case for value investors, blending attractive valuation multiples with good profitability, acceptable financial health, and modest growth prospects. It exemplifies the type of stock that screens like the "Decent Value" method aim to uncover: one where price may not fully reflect fundamental strength, offering a margin of safety without sacrificing quality. While retail sector dynamics and consumer trends warrant ongoing attention, the metrics indicate a company that could be poised for reevaluation by the market.
For investors interested in exploring similar opportunities, more results from this value-oriented screen can be found here. Additionally, a detailed fundamental analysis report for GAP is available via this link.
Disclaimer: This article is for informational purposes only and does not constitute investment advice. Readers should conduct their own research and consult with a financial advisor before making investment decisions.