
For investors looking to find high-growth market leaders, the CANSLIM method, created by William O'Neil, provides a structured approach. This growth investing plan joins detailed fundamental study with technical market timing to find stocks with solid earnings momentum, institutional support, and leading traits. The aim is to locate companies in the initial phases of major growth, just as the wider market is starting to see their possibility.
A recent scan using main CANSLIM filters identified Futu Holdings Ltd. ADR (NASDAQ:FUTU) as a candidate deserving more examination. The Hong Kong-based digital brokerage and wealth management platform seems to match several important parts of the strategy.
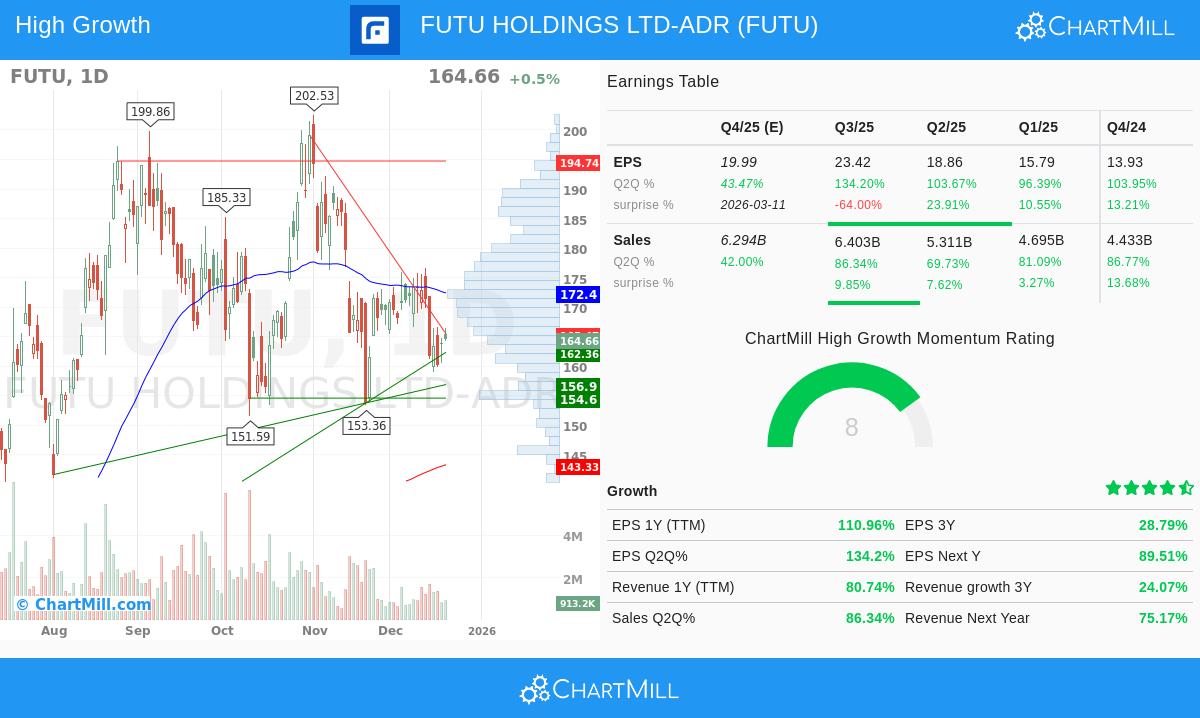
Reviewing the Fundamental "CAN" Criteria
The first part of the CANSLIM acronym centers on the fundamental condition and growth path of a company. Futu's recent financial results show force in these parts.
- Current Quarterly Earnings & Sales (The "C"): CANSLIM stresses powerful recent growth. Futu's most recent quarterly earnings per share jumped 134.2% against the same quarter last year, well above the common minimum of 18-25%. Also, quarterly revenue growth was 86.3%. This increase in both profit and sales is a main sign the plan looks for.
- Annual Earnings Increases (The "A"): The strategy needs a shown history of growth, not just one good quarter. Futu's earnings per share have increased at an average yearly rate of 28.8% over the last three years, safely above the 25% mark. Also, the company's Return on Equity (ROE) of 26.9% shows very efficient use of shareholder money, another good fundamental sign.
- New Products, New Highs (The "N"): While based on quality, Futu works in the digitization of financial services, a changing shift in Asian markets. Its "Futu NiuNiu" platform shows a current method to brokerage and investing. From a technical view, the "new highs" part is partly seen in its strong relative strength against the market.
Examining the "SLIM" Market Factors
The later criteria look at the stock's market action and support, key for timing entries in a growth-focused strategy.
- Supply and Demand & Leader vs. Laggard (The "S" & "L"): Futu keeps a fair debt-to-equity ratio of 0.36, pointing to a balanced capital structure without too much leverage, a plus for the "Supply" factor. Most importantly, for the "Leader" rule, Futu has a ChartMill Relative Strength (CRS) rating of 92.14. This means it has done better than over 92% of the market in the past year, a clear sign of a market leader that CANSLIM investors focus on.
- Institutional Sponsorship (The "I"): Institutional ownership is at 52.4%. This amount is in a good range, showing professional investor attention without being so high that all possible institutional buying might already be done. The plan looks for stocks that are being found and bought by institutions, not those they already completely own.
- Market Direction (The "M"): This main rule tells investors that even the strongest stocks can have difficulty in a poor market. At this time, the S&P 500 shows a positive short-term direction, which gives a more helpful setting for looking at growth-focused ideas like Futu.
Technical and Fundamental Summary
A look at Futu's separate reports gives a balanced view. The fundamental analysis report gives the stock a score of 6/10, noting its "excellent growth" and high-level profitability in its field, though it mentions some questions about financial condition measures. The technical analysis report also gives a 6/10 score, recognizing its place as a top performer over the past year but indicating recent mixed signals and consolidation inside a trading range. The report notes a fair setup pattern, suggesting the stock may be forming a base for its next possible step.
A Candidate for More Study
Based on the measured filters of the CANSLIM scan, Futu Holdings shows a strong profile for growth investors. It shows the forceful earnings and sales momentum, high relative strength, and acceptable institutional ownership that the method is made to identify. As with any investment scan, this acts as a beginning for more detailed investigation. Investors should study the company's competitive field, regulatory setting, and specific chart patterns for possible entry points, always within the view of the wider market direction.
Interested in finding other stocks that currently pass this CANSLIM-based scan? You can find the complete, current list of results using this pre-configured screener link.
Disclaimer: This article is for information and learning only. It does not form a suggestion to buy, sell, or hold any security, nor is it meant as investment guidance of any type. All investment choices include risk, and readers should do their own study and talk with a qualified financial advisor before making any investment choices.