
Investment strategies that seek growth at reasonable prices have long appealed to investors looking for companies with strong expansion potential that aren't trading at excessive valuations. The Affordable Growth approach specifically targets equities demonstrating solid growth trajectories while maintaining sound financial health and profitability, all without demanding premium valuations that could limit upside potential. This balanced methodology helps identify firms positioned for sustainable expansion rather than speculative bubbles.
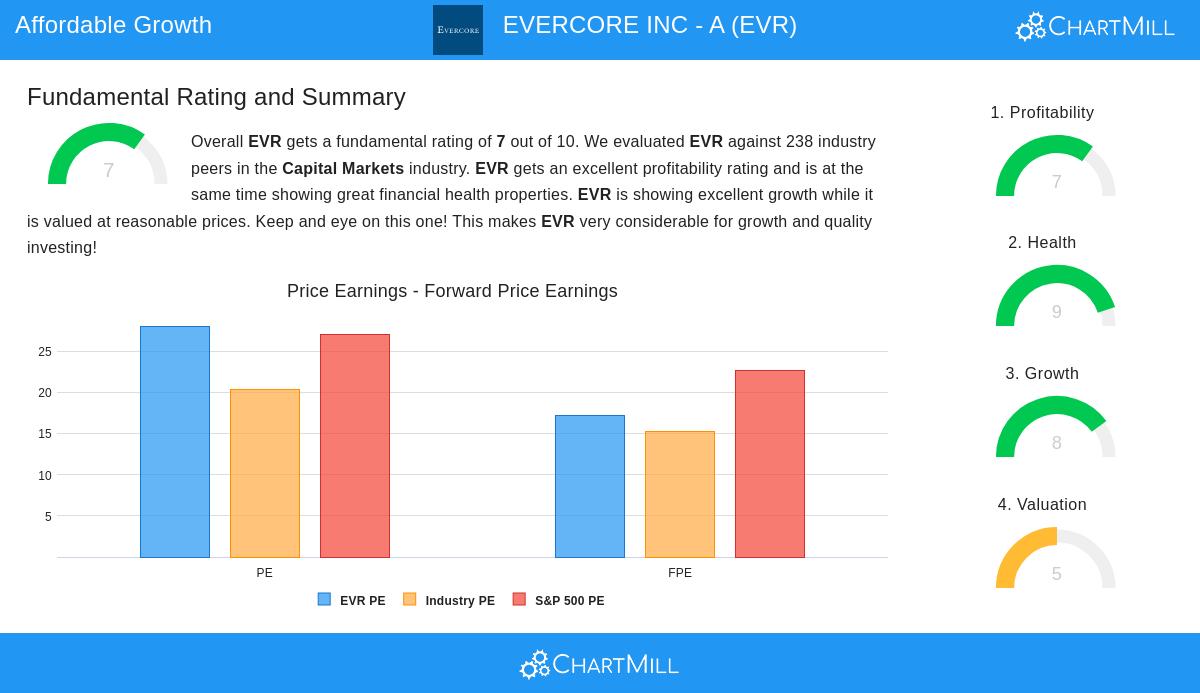
EVERCORE INC - A (NYSE:EVR) emerges as a notable candidate within this investment framework according to recent fundamental analysis. The investment banking advisory company achieves an overall fundamental rating of 7 out of 10, placing it well above average compared to industry peers in the capital markets sector.
Growth Characteristics Demonstrate Strong Momentum
The company's growth profile stands out with an 8/10 rating, driven by impressive recent performance and promising forward projections. Revenue expanded by 23.24% over the past year, while earnings per share surged by 56.47%, indicating efficient scaling of operations alongside top-line growth. Looking ahead, analysts project EPS growth of 36.34% annually alongside revenue expansion of 19.48% per year, suggesting the growth trajectory remains solid. Notably, both EPS and revenue growth rates are accelerating compared to historical performance, indicating strengthening business momentum rather than cyclical peaks.
Valuation Presents Reasonable Entry Point
Despite these strong growth metrics, EVR maintains a reasonable valuation score of 5/10. The forward P/E ratio of 17.13 sits below the S&P 500 average of 22.63, providing relative value despite the company's superior growth profile. The PEG ratio, which factors growth into the valuation equation, indicates the stock may be undervalued given its earnings expansion potential. This valuation discipline is crucial for affordable growth strategies, as it helps avoid overpaying for growth and provides margin of safety should projections not fully materialize.
Profitability and Health Support Sustainable Growth
The company's profitability score of 7/10 reflects strong operational efficiency, with return on equity of 27.93% and return on invested capital of 16.74% both ranking in the top decile among industry peers. These metrics demonstrate management's ability to generate substantial returns from shareholder capital, a key consideration for growth investors seeking quality expansion rather than growth at any cost.
Financial health receives an exceptional 9/10 rating, featuring a debt-to-equity ratio of just 0.18 and current ratio of 2.82, indicating minimal financial risk and strong liquidity. The Altman-Z score of 6.43 suggests very low bankruptcy risk, providing stability that growth investors often sacrifice when pursuing high-expansion companies. This financial foundation supports sustainable growth without excessive leverage, aligning perfectly with the affordable growth strategy's emphasis on fundamental soundness.
Dividend Profile Adds Total Return Component
While not the primary focus for growth strategies, EVR's dividend score of 6/10 provides an additional return component. The company has increased its dividend for 10 consecutive years with an average annual growth rate of 7.85%, demonstrating commitment to shareholder returns even while prioritizing growth initiatives. The payout ratio of 30.46% remains sustainable and allows ample room for reinvestment in business expansion.
The combination of strong growth prospects, reasonable valuation, excellent profitability, and very good financial health makes EVR a noteworthy candidate for investors employing affordable growth methodologies. The company's fundamental profile suggests it possesses the characteristics necessary for sustainable expansion without demanding speculative valuations.
For investors interested in exploring similar opportunities, additional affordable growth candidates can be identified through this predefined screen that applies consistent fundamental criteria across the market.
Disclaimer: This analysis is based on fundamental data and ratings provided by ChartMill and should not be considered investment advice. Investors should conduct their own research and consider their individual financial circumstances before making investment decisions.