
In this article, we'll take a closer look at DEXCOM INC (NASDAQ:DXCM) as a potential candidate for growth investing. While it's important for investors to conduct their own research, DEXCOM INC has piqued our interest by appearing on our strong growth and breakout radar. Let's explore further.
Growth Analysis for DXCM
ChartMill assigns a Growth Rating to each stock, ranging from 0 to 10. This rating is determined by analyzing different growth elements, including EPS and revenue growth, spanning both historical and future figures. In the case of DXCM, the assigned 8 reflects its growth potential:
- The Earnings Per Share has grown by an nice 9.27% over the past year.
- DXCM shows a strong growth in Earnings Per Share. Measured over the last years, the EPS has been growing by 29.25% yearly.
- DXCM shows quite a strong growth in Revenue. In the last year, the Revenue has grown by 11.34%.
- DXCM shows a strong growth in Revenue. Measured over the last years, the Revenue has been growing by 22.27% yearly.
- Based on estimates for the next years, DXCM will show a quite strong growth in Earnings Per Share. The EPS will grow by 19.91% on average per year.
- Based on estimates for the next years, DXCM will show a quite strong growth in Revenue. The Revenue will grow by 14.72% on average per year.
Assessing Health for DXCM
ChartMill assigns a Health Rating to every stock. This score ranges from 0 to 10 and evaluates the different health aspects like liquidity and solvency, both absolutely, but also relative to the industry peers. DXCM scores a 6 out of 10:
- An Altman-Z score of 5.50 indicates that DXCM is not in any danger for bankruptcy at the moment.
- DXCM has a Altman-Z score of 5.50. This is amongst the best in the industry. DXCM outperforms 80.32% of its industry peers.
- The Debt to FCF ratio of DXCM is 3.96, which is a good value as it means it would take DXCM, 3.96 years of fcf income to pay off all of its debts.
- DXCM has a Debt to FCF ratio of 3.96. This is amongst the best in the industry. DXCM outperforms 84.57% of its industry peers.
- The current and quick ratio evaluation for DXCM is rather negative, while it does have excellent solvency and profitability. These ratios do not necessarly indicate liquidity issues and need to be evaluated against the specifics of the business.
Profitability Assessment of DXCM
Discover ChartMill's exclusive Profitability Rating, a proprietary metric that assesses stocks on a scale of 0 to 10. It takes into consideration various profitability ratios and margins, both in absolute terms and relative to industry peers. Notably, DXCM has achieved a 9:
- With an excellent Return On Assets value of 8.89%, DXCM belongs to the best of the industry, outperforming 90.43% of the companies in the same industry.
- The Return On Equity of DXCM (27.40%) is better than 96.81% of its industry peers.
- DXCM's Return On Invested Capital of 14.49% is amongst the best of the industry. DXCM outperforms 95.74% of its industry peers.
- Measured over the past 3 years, the Average Return On Invested Capital for DXCM is above the industry average of 7.83%.
- The 3 year average ROIC (11.25%) for DXCM is below the current ROIC(14.49%), indicating increased profibility in the last year.
- The Profit Margin of DXCM (14.29%) is better than 90.96% of its industry peers.
- In the last couple of years the Profit Margin of DXCM has grown nicely.
- DXCM has a Operating Margin of 16.20%. This is amongst the best in the industry. DXCM outperforms 87.23% of its industry peers.
- In the last couple of years the Operating Margin of DXCM has grown nicely.
- Looking at the Gross Margin, with a value of 61.78%, DXCM is in the better half of the industry, outperforming 62.77% of the companies in the same industry.
Why is DXCM a setup?
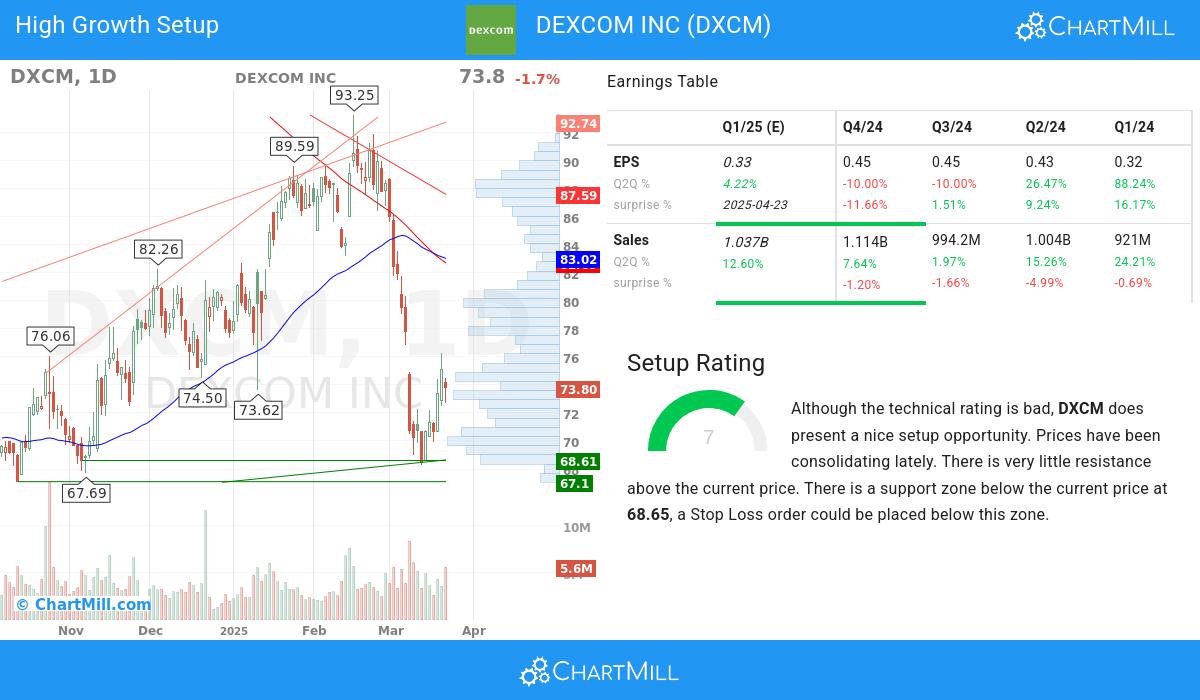
ChartMill provides a Setup Rating for each stock. This rating, ranging from 0 to 10, assesses the level of consolidation in the stock based on multiple short-term technical indicators. Currently, DXCM has a 7 as its setup rating, indicating its current consolidation status.
DXCM has a bad technical rating, but it does show a decent setup pattern. Prices have been consolidating lately. There is very little resistance above the current price. There is a support zone below the current price at 68.65, a Stop Loss order could be placed below this zone.
Our Strong Growth screener lists more Strong Growth stocks and is updated daily.
For an up to date full fundamental analysis you can check the fundamental report of DXCM
Check the latest full technical report of DXCM for a complete technical analysis.
Disclaimer
This article should in no way be interpreted as advice. The article is based on the observed metrics at the time of writing, but you should always make your own analysis and trade or invest at your own responsibility.