Will DUKE ENERGY CORP (NYSE:DUK) breakout?
By Mill Chart
Last update: May 3, 2025
Our stock screener has spotted DUKE ENERGY CORP (NYSE:DUK) as a possible breakout candidate. A technical breakout setup pattern occurs when the stock is consolidating after a nice uptrend. Whether the actual breakout occurs remains to be seen of course, but it may be interesting to keep an eye on NYSE:DUK.
Technical Analysis Observations
ChartMill assigns a Technical Rating to every stock. This score ranges from 0 to 10 and is updated daily. The score is determined by evaluating multiple technical indicators and properties.
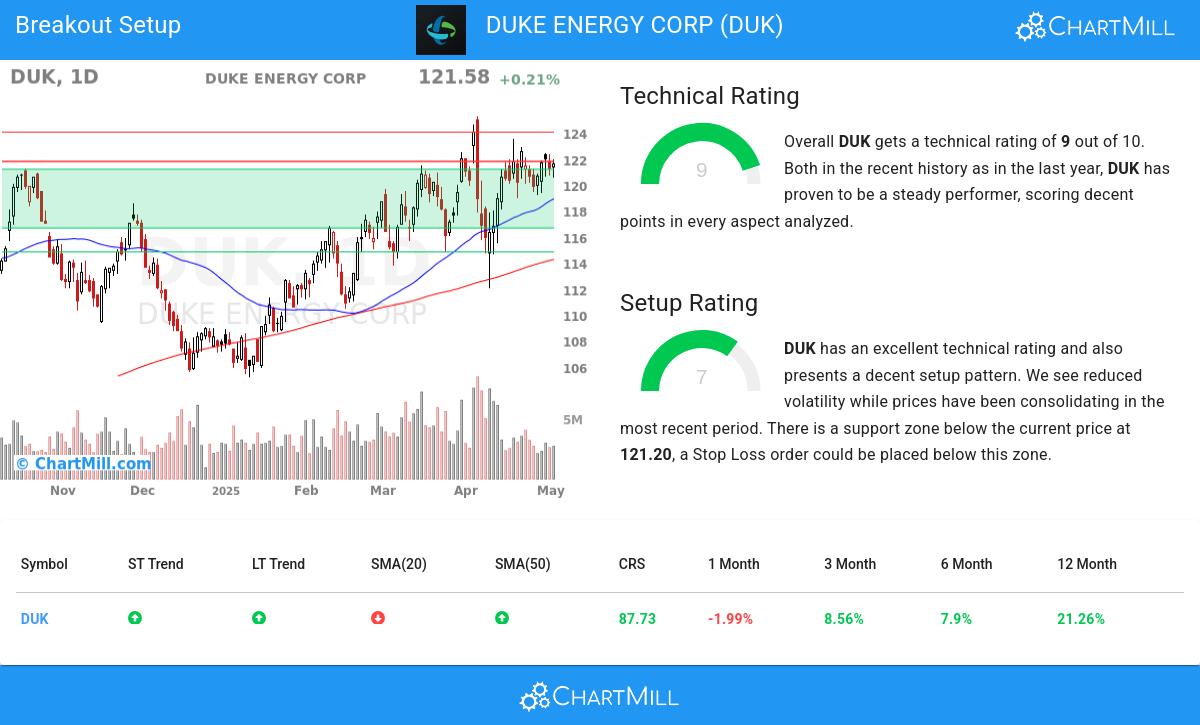
Overall DUK gets a technical rating of 9 out of 10. Both in the recent history as in the last year, DUK has proven to be a steady performer, scoring decent points in every aspect analyzed.
- The long and short term trends are both positive. This is looking good!
- When comparing the yearly performance of all stocks, we notice that DUK is one of the better performing stocks in the market, outperforming 87% of all stocks. On top of that, DUK also shows a nice and consistent pattern of rising prices.
- DUK is currently trading in the upper part of its 52 week range. The market is still in the middle of its 52 week range, so DUK slightly outperforms the market at the moment.
- DUK is an average performer in the Electric Utilities industry, it outperforms 62% of 46 stocks in the same industry.
- In the last month DUK has a been trading in the 112.07 - 125.27 range, which is quite wide. It is currently trading in the middle of this range, so some resistance may be found above.
For an up to date full technical analysis you can check the technical report of DUK
Looking at the Setup
In addition to the Technical Rating, ChartMill provides a Setup Rating for each stock. This rating, ranging from 0 to 10, assesses the level of consolidation in the stock based on multiple short-term technical indicators. Currently, DUK has a 7 as its setup rating, indicating its current consolidation status.
DUK has an excellent technical rating and also presents a decent setup pattern. Prices have been consolidating lately and the volatility has been reduced. There is a support zone below the current price at 121.20, a Stop Loss order could be placed below this zone.
How to trade DUK?
For a potential trade one would typically wait until the stock breaks out of the consolidation zone to enter the stock and it could be sold again for a loss when it would fall back below the zone.
Please note that this article should not be construed as trading advice. The information provided is solely based on automated technical analysis and serves to highlight technical observations. It is important to conduct your own analysis and make trading decisions based on your own judgment and responsibility.
More breakout setups can be found in our Breakout screener.
Keep in mind
This article should in no way be interpreted as advice. The article is based on the observed metrics at the time of writing, but you should always make your own analysis and trade or invest at your own responsibility.
116.44
-0.87 (-0.74%)
Find more stocks in the Stock Screener
DUK Latest News and Analysis
 15 days ago - ChartmillWhat's going on in today's session: S&P500 movers
Uncover the latest developments among S&P500 stocks in today's session. Stay tuned to the S&P500 index's top gainers and losers on Tuesday.
 18 days ago - ChartmillWill DUKE ENERGY CORP (NYSE:DUK) breakout?
DUKE ENERGY CORP (NYSE:DUK) Reveals Intriguing Technical Aspects. Indications Suggest NYSE:DUK Could Be on the Verge of a Breakout. Here's What You Need to Know.
