
Take a closer look at BRISTOL-MYERS SQUIBB CO (NYSE:BMY), a remarkable value stock uncovered by our stock screener. NYSE:BMY excels in fundamentals and maintains a very reasonable valuation. Let's break it down further.
Valuation Examination for NYSE:BMY
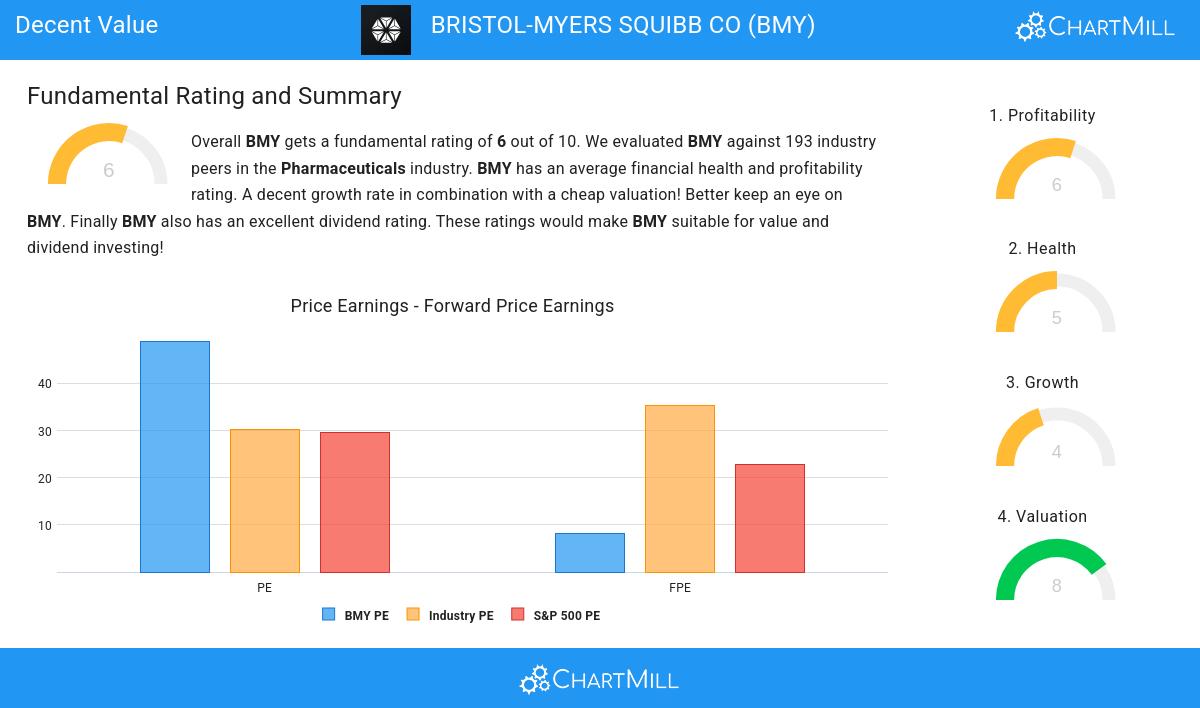
ChartMill provides a Valuation Rating to every stock, ranging from 0 to 10. This rating assesses various valuation aspects, comparing price to earnings and cash flows, while considering factors like profitability and growth. NYSE:BMY boasts a 8 out of 10:
- Compared to the rest of the industry, the Price/Earnings ratio of BMY indicates a rather cheap valuation: BMY is cheaper than 80.43% of the companies listed in the same industry.
- A Price/Forward Earnings ratio of 8.19 indicates a reasonable valuation of BMY.
- 91.30% of the companies in the same industry are more expensive than BMY, based on the Price/Forward Earnings ratio.
- BMY's Price/Forward Earnings ratio indicates a rather cheap valuation when compared to the S&P500 average which is at 22.70.
- Based on the Enterprise Value to EBITDA ratio, BMY is valued cheaper than 91.30% of the companies in the same industry.
- BMY's Price/Free Cash Flow ratio is rather cheap when compared to the industry. BMY is cheaper than 93.48% of the companies in the same industry.
- The low PEG Ratio(NY), which compensates the Price/Earnings for growth, indicates a rather cheap valuation of the company.
- The decent profitability rating of BMY may justify a higher PE ratio.
- A more expensive valuation may be justified as BMY's earnings are expected to grow with 75.69% in the coming years.
Exploring NYSE:BMY's Profitability
Discover ChartMill's exclusive Profitability Rating, a proprietary metric that assesses stocks on a scale of 0 to 10. It takes into consideration various profitability ratios and margins, both in absolute terms and relative to industry peers. Notably, NYSE:BMY has achieved a 6:
- The Return On Assets of BMY (-9.66%) is better than 70.11% of its industry peers.
- BMY has a better Return On Invested Capital (13.21%) than 90.22% of its industry peers.
- The last Return On Invested Capital (13.21%) for BMY is above the 3 year average (12.29%), which is a sign of increasing profitability.
- The Operating Margin of BMY (23.90%) is better than 90.22% of its industry peers.
- Looking at the Gross Margin, with a value of 75.26%, BMY belongs to the top of the industry, outperforming 82.61% of the companies in the same industry.
Looking at the Health
A critical element of ChartMill's stock evaluation is the Health Rating, which spans from 0 to 10. This rating considers multiple health factors, including liquidity and solvency, both in absolute terms and relative to industry peers. NYSE:BMY has received a 5 out of 10:
- With a decent Altman-Z score value of 2.13, BMY is doing good in the industry, outperforming 69.02% of the companies in the same industry.
- BMY has a debt to FCF ratio of 3.56. This is a good value and a sign of high solvency as BMY would need 3.56 years to pay back of all of its debts.
- With an excellent Debt to FCF ratio value of 3.56, BMY belongs to the best of the industry, outperforming 88.59% of the companies in the same industry.
ChartMill's Evaluation of Growth
ChartMill assigns a Growth Rating to every stock. This score ranges from 0 to 10 and evaluates the different growth aspects like EPS and Revenue, both in the past as in the future. NYSE:BMY scores a 4 out of 10:
- BMY shows quite a strong growth in Revenue. Measured over the last years, the Revenue has been growing by 13.06% yearly.
- BMY is expected to show a strong growth in Earnings Per Share. In the coming years, the EPS will grow by 39.59% yearly.
- The EPS growth rate is accelerating: in the next years the growth will be better than in the last years.
More Decent Value stocks can be found in our Decent Value screener.
Our latest full fundamental report of BMY contains the most current fundamental analsysis.
Keep in mind
This is not investing advice! The article highlights some of the observations at the time of writing, but you should always make your own analysis and invest based on your own insights.