
Our stock screening tool has identified BEST BUY CO INC (NYSE:BBY) as a strong dividend contender with robust fundamentals. BBY exhibits commendable financial health and profitability, all while offering a sustainable dividend. Let's delve into each aspect below.
What does the Dividend looks like for BBY
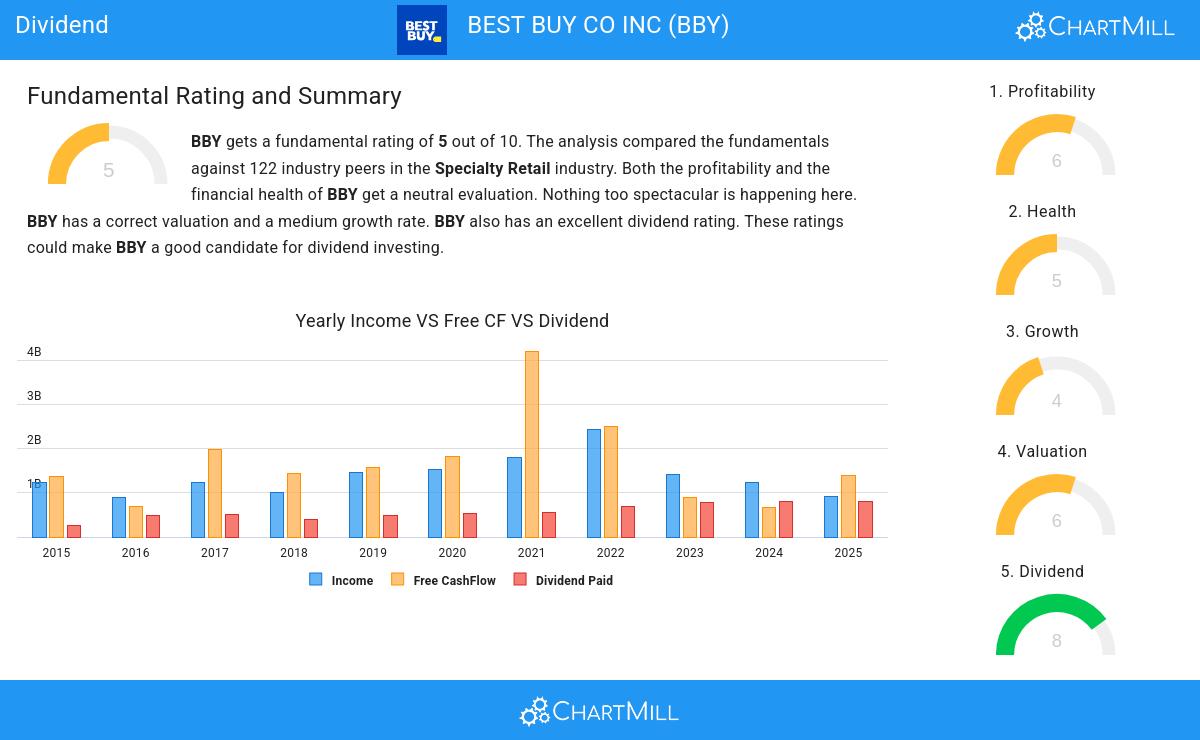
ChartMill employs its own Dividend Rating system for all stocks. This score, on a scale of 0 to 10, is determined by evaluating different dividend factors, such as yield, historical performance, dividend growth, and sustainability. BBY has been assigned a 8 for dividend:
- BBY has a Yearly Dividend Yield of 5.41%, which is a nice return.
- Compared to an average industry Dividend Yield of 5.01, BBY pays a better dividend. On top of this BBY pays more dividend than 90.98% of the companies listed in the same industry.
- Compared to an average S&P500 Dividend Yield of 2.39, BBY pays a better dividend.
- The dividend of BBY is nicely growing with an annual growth rate of 13.24%!
- BBY has been paying a dividend for at least 10 years, so it has a reliable track record.
- BBY has not decreased its dividend for at least 10 years, so it has a reliable track record of non decreasing dividend.
Health Assessment of BBY
ChartMill assigns a proprietary Health Rating to each stock. The score is computed by evaluating various liquidity and solvency ratios and ranges from 0 to 10. BBY was assigned a score of 5 for health:
- BBY has a debt to FCF ratio of 0.83. This is a very positive value and a sign of high solvency as it would only need 0.83 years to pay back of all of its debts.
- BBY has a Debt to FCF ratio of 0.83. This is amongst the best in the industry. BBY outperforms 80.33% of its industry peers.
- A Debt/Equity ratio of 0.41 indicates that BBY is not too dependend on debt financing.
Profitability Examination for BBY
ChartMill assigns a proprietary Profitability Rating to each stock. The score is computed by evaluating various profitability ratios and margins and ranges from 0 to 10. BBY was assigned a score of 6 for profitability:
- BBY's Return On Assets of 6.27% is fine compared to the rest of the industry. BBY outperforms 73.77% of its industry peers.
- Looking at the Return On Equity, with a value of 33.01%, BBY belongs to the top of the industry, outperforming 86.07% of the companies in the same industry.
- BBY's Return On Invested Capital of 18.94% is amongst the best of the industry. BBY outperforms 86.07% of its industry peers.
- The Average Return On Invested Capital over the past 3 years for BBY is above the industry average of 14.49%.
More Best Dividend stocks can be found in our Best Dividend screener.
Check the latest full fundamental report of BBY for a complete fundamental analysis.
Keep in mind
This is not investing advice! The article highlights some of the observations at the time of writing, but you should always make your own analysis and invest based on your own insights.