
Unearth the potential of BOOZ ALLEN HAMILTON HOLDINGS (NYSE:BAH) as a dividend stock recommended by our stock screening tool. BAH maintains a robust financial footing and delivers a sustainable dividend. We'll delve into the details below.
Understanding BAH's Dividend
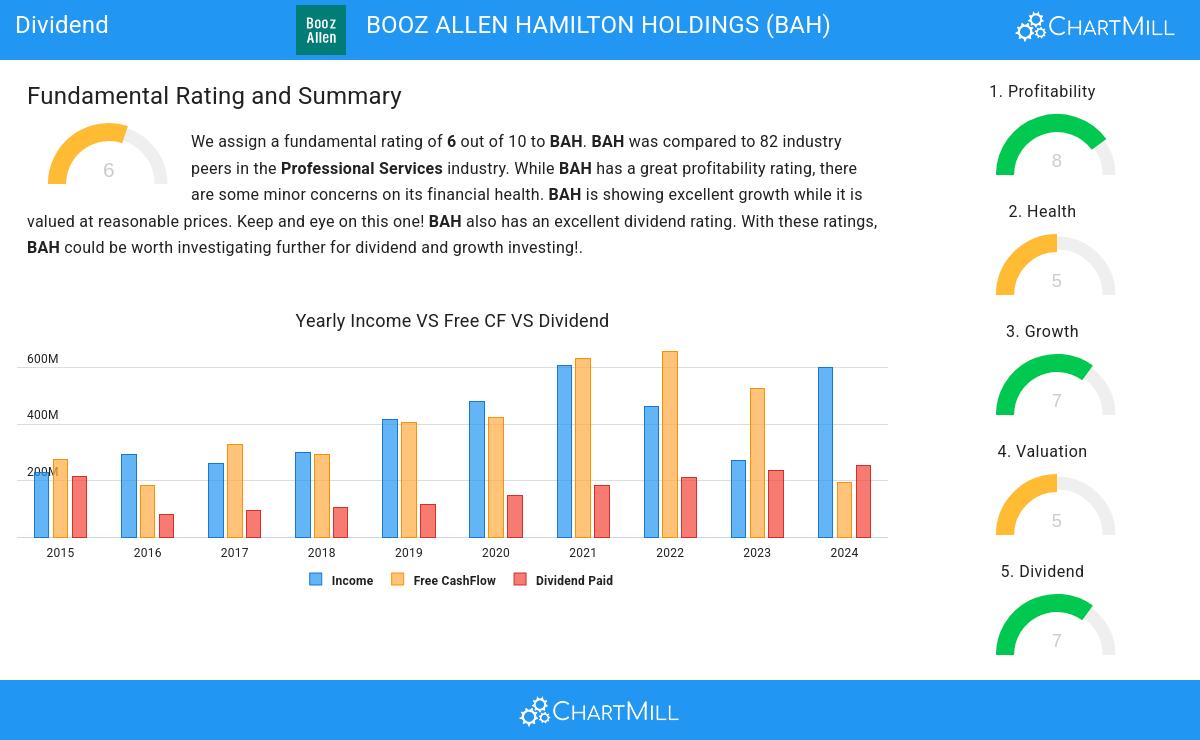
ChartMill assigns a Dividend Rating to every stock. This score ranges from 0 to 10 and evaluates the different dividend aspects, including the yield, the growth and sustainability. BAH scores a 7 out of 10:
- BAH's Dividend Yield is rather good when compared to the industry average which is at 2.16. BAH pays more dividend than 84.15% of the companies in the same industry.
- On average, the dividend of BAH grows each year by 19.21%, which is quite nice.
- BAH has paid a dividend for at least 10 years, which is a reliable track record.
- BAH has not decreased their dividend for at least 10 years, which is a reliable track record.
- 25.74% of the earnings are spent on dividend by BAH. This is a low number and sustainable payout ratio.
Understanding BAH's Health Score
ChartMill assigns a proprietary Health Rating to each stock. The score is computed by evaluating various liquidity and solvency ratios and ranges from 0 to 10. BAH was assigned a score of 5 for health:
- An Altman-Z score of 5.19 indicates that BAH is not in any danger for bankruptcy at the moment.
- BAH has a better Altman-Z score (5.19) than 87.80% of its industry peers.
- The Debt to FCF ratio of BAH is 4.00, which is a good value as it means it would take BAH, 4.00 years of fcf income to pay off all of its debts.
- With a decent Quick ratio value of 1.57, BAH is doing good in the industry, outperforming 60.98% of the companies in the same industry.
Profitability Insights: BAH
ChartMill's Profitability Rating offers a unique perspective on stock analysis, providing scores from 0 to 10. These ratings consider a wide range of profitability metrics and margins, both in comparison to industry peers and on their own merits. For BAH, the assigned 8 is a significant indicator of profitability:
- BAH has a better Return On Assets (15.10%) than 90.24% of its industry peers.
- BAH has a better Return On Equity (85.10%) than 93.90% of its industry peers.
- BAH has a better Return On Invested Capital (23.56%) than 91.46% of its industry peers.
- The 3 year average ROIC (13.75%) for BAH is below the current ROIC(23.56%), indicating increased profibility in the last year.
- BAH's Profit Margin of 7.00% is fine compared to the rest of the industry. BAH outperforms 71.95% of its industry peers.
- With an excellent Operating Margin value of 11.08%, BAH belongs to the best of the industry, outperforming 80.49% of the companies in the same industry.
- BAH's Operating Margin has improved in the last couple of years.
- The Gross Margin of BAH (54.71%) is better than 65.85% of its industry peers.
More Best Dividend stocks can be found in our Best Dividend screener.
Our latest full fundamental report of BAH contains the most current fundamental analsysis.
Keep in mind
This article should in no way be interpreted as advice. The article is based on the observed metrics at the time of writing, but you should always make your own analysis and trade or invest at your own responsibility.