
Technical Breakout Setup for Bank of America Corp (NYSE:BAC)
By Mill Chart
Last update: Oct 7, 2025
Bank of America Corp (NYSE:BAC) has been identified by a systematic screening process made to find promising technical breakout candidates. This process uses two specific indicators from ChartMill: the Technical Rating, which measures a stock's general technical condition and trend strength, and the Setup Quality Rating, which examines consolidation patterns to find good entry points. Stocks with high scores in both areas are often technically good companies building constructive price foundations, indicating a chance for upward price action.
Technical Strength Assessment
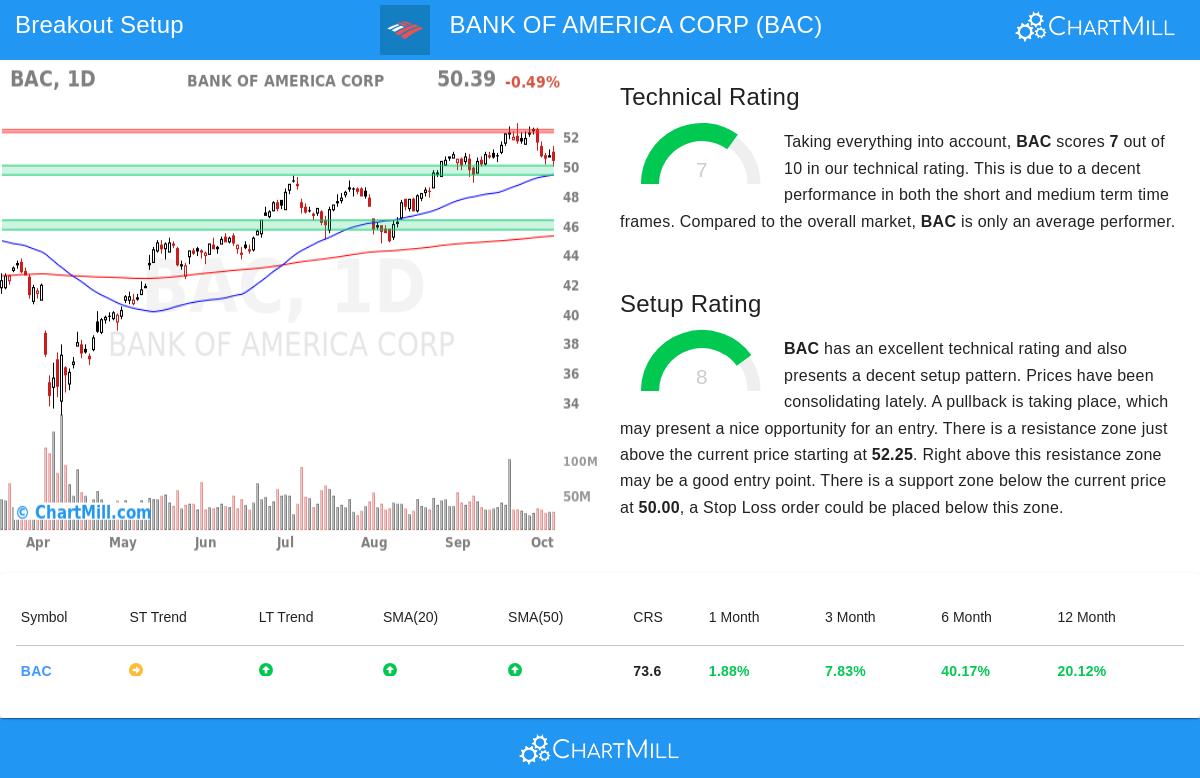
Bank of America shows firm technical foundations with a Technical Rating of 7, meaning the stock is in a confirmed upward trend. This rating comes from several good factors that match the breakout strategy's need for technically healthy stocks. The detailed technical analysis shows several supportive details:
- Long-term trend stays positive while short-term action indicates neutral consolidation
- Price is above all main moving averages (20-day: $51.22, 50-day: $49.37, 200-day: $45.24)
- Good relative performance in the banking sector, doing better than 77% of industry peers
- Respectable yearly performance with 20.12% gains over the past twelve months
The steady position above important moving averages and positive long-term trend gives the basic strength needed for lasting breakouts, answering the "which stock" question in technical trading by finding fundamentally sound technical setups.
Setup Quality Evaluation
With a Setup Rating of 8, Bank of America shows a notable consolidation pattern that provides clear risk management parameters. This high setup score means the stock has been trading in a specific range, forming the base for a possible breakout move. Recent price action indicates:
- Trading inside a clear monthly range between $49.46 and $52.88
- Several established support zones, especially between $49.37 and $50.00
- A specific resistance area between $52.25 and $52.43
- Current price is in the middle of the recent range, allowing for calculated entry methods
The consolidation pattern provides the "when to buy" part of the strategy, giving identifiable support levels for stop placement and resistance zones that, if surpassed, could signal the next move higher.
Trading Considerations
The technical setup indicates a possible entry above current resistance levels with clearly defined risk parameters. The automated analysis finds:
- Possible entry point: $51.38 (above the 10-day moving average)
- Stop loss level: $49.88 (below key support)
- Risk per share: $1.50 (2.91% of entry price)
The Average True Range of 1.75% shows moderate daily volatility, while the stock's large average trading volume of 34 million shares gives good liquidity for position entry and exit.
Market Context and Outlook
Bank of America's technical position happens during a generally positive market environment, with the S&P 500 showing both short and long-term positive trends. The bank's current consolidation near the top of its 52-week range, paired with good sector-relative performance, indicates a chance for continued upward movement if the wider market keeps its positive direction.
For investors looking for similar technical breakout candidates, the Technical Breakout Setups screen offers daily updated options meeting these strict technical criteria.
Disclaimer: This analysis is based on technical indicators and pattern recognition and should not be considered as investment advice. Always conduct your own research and consider your risk tolerance before making any investment decisions. Technical analysis does not guarantee future performance and should be used as one tool among many in investment decision-making.
54.09
+0.9 (+1.69%)
Find more stocks in the Stock Screener
BAC Latest News and Analysis
