
BANK OF AMERICA CORP (NYSE:BAC) Shows Strong Technical Setup for Potential Breakout
By Mill Chart
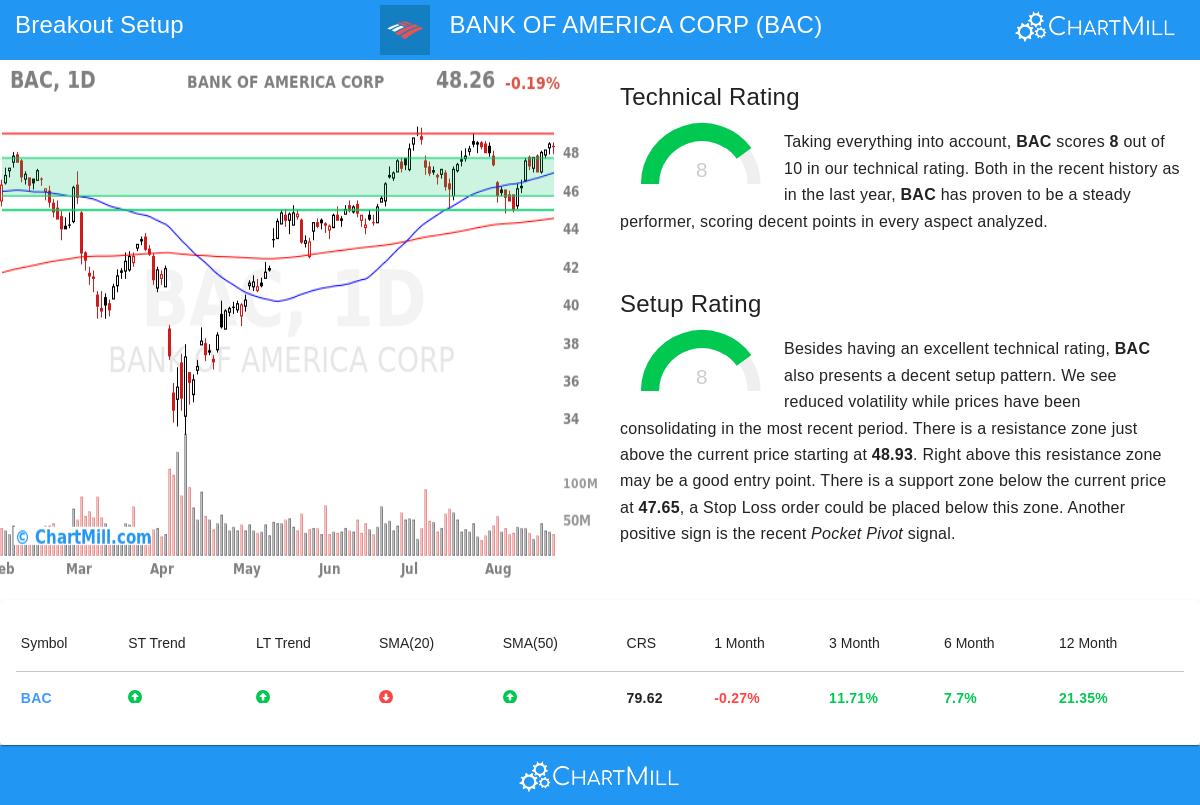
Last update: Aug 22, 2025
Technical analysis investors often look for stocks showing both good underlying momentum and attractive entry chances, usually found through consolidation patterns before possible breakouts. This method uses two important measures: the Technical Rating, which checks a stock's general condition and trend force, and the Setup Rating, which judges the standard of its present consolidation pattern. BANK OF AMERICA CORP (NYSE:BAC) appears as a candidate matching this method, showing traits that could interest traders searching for technically good breakout chances.
Technical Strength and Momentum
BANK OF AMERICA CORP shows good technical condition, getting a Technical Rating of 8 out of 10. This number shows a few positive points detailed in the technical analysis report. Both short-term and long-term trends are positive, pointing to continued upward momentum across various periods. The stock does better than 79% of all stocks in its yearly performance and is in the top group inside the banking industry, doing better than 81% of its 393 peers. Now trading close to its 52-week high of $49.31, BAC shows it is moving with the wider market's force while staying above important moving averages like the SMA50 ($46.87), SMA100 ($43.99), and SMA200 ($44.48), all of which are going up. This technical base is important because stocks with strong trends often keep their momentum, making them better choices for breakout plans.
Setup Quality and Consolidation Pattern
Along with its good technical base, BAC shows an interesting setup pattern with a Setup Rating of 8. The stock has been moving within the $44.75-$48.55 area over the last month, showing lower volatility while trading near the top edge of this area. This consolidation forms a possible base for upward price movement. The setup finds a clear resistance area between $48.93-$48.94, with a proposed entry point at $48.95, just above this resistance, where a breakout could show new momentum. Support is found at $47.65, giving a sensible level for stop-loss orders about 8.13% under the entry point. Also, the presence of a Pocket Pivot signal, where price increases on volume greater than the highest down volume of the prior ten days, hints at institutional buying, adding trust to the setup. These consolidation traits are important because they allow for clear risk control and possibly attractive risk-reward ratios.
Market Context and Implementation
The present positive trends in both short-term and long-term S&P 500 performance create a supportive environment for breakout plans. For investors wanting to find similar chances, the Technical Breakout Setups screen often finds stocks meeting these technical and setup standards, acting as a useful beginning for more study.
Disclaimer: This analysis is based on technical indicators and historical performance patterns and should not be seen as investment advice. All trading decisions should be made after complete personal research and thought of individual risk tolerance.
53.2
-0.09 (-0.17%)
Find more stocks in the Stock Screener
BAC Latest News and Analysis


