
Exploring Growth Potential: AXON ENTERPRISE INC (NASDAQ:AXON) and Its Base Formation. Growth investors seek promising revenue and EPS growth, and AXON ENTERPRISE INC has come under our scrutiny for potential growth investing. While it's crucial to do your own research, we've detected AXON ENTERPRISE INC on our screen for growth with base formation, suggesting it merits a closer look.
Looking at the Growth
To evaluate a stock's growth potential, ChartMill utilizes a Growth Rating on a scale of 0 to 10. This comprehensive assessment considers various growth aspects, including historical and estimated EPS and revenue growth. NASDAQ:AXON has achieved a 9 out of 10:
- AXON shows a strong growth in Earnings Per Share. In the last year, the EPS has been growing by 32.61%, which is quite impressive.
- The Earnings Per Share has been growing by 45.65% on average over the past years. This is a very strong growth
- Looking at the last year, AXON shows a very strong growth in Revenue. The Revenue has grown by 63.57%.
- Measured over the past years, AXON shows a very strong growth in Revenue. The Revenue has been growing by 30.06% on average per year.
- Based on estimates for the next years, AXON will show a very strong growth in Earnings Per Share. The EPS will grow by 24.30% on average per year.
- Based on estimates for the next years, AXON will show a very strong growth in Revenue. The Revenue will grow by 25.71% on average per year.
ChartMill's Evaluation of Health
ChartMill assigns a Health Rating to every stock. This score ranges from 0 to 10 and evaluates the different health aspects like liquidity and solvency, both absolutely, but also relative to the industry peers. NASDAQ:AXON scores a 8 out of 10:
- AXON has an Altman-Z score of 15.86. This indicates that AXON is financially healthy and has little risk of bankruptcy at the moment.
- AXON's Altman-Z score of 15.86 is amongst the best of the industry. AXON outperforms 96.88% of its industry peers.
- AXON has a debt to FCF ratio of 3.09. This is a good value and a sign of high solvency as AXON would need 3.09 years to pay back of all of its debts.
- AXON has a better Debt to FCF ratio (3.09) than 84.38% of its industry peers.
- A Debt/Equity ratio of 0.32 indicates that AXON is not too dependend on debt financing.
- AXON has a better Debt to Equity ratio (0.32) than 67.19% of its industry peers.
- A Current Ratio of 2.96 indicates that AXON has no problem at all paying its short term obligations.
- With a decent Current ratio value of 2.96, AXON is doing good in the industry, outperforming 67.19% of the companies in the same industry.
- A Quick Ratio of 2.63 indicates that AXON has no problem at all paying its short term obligations.
- AXON has a better Quick ratio (2.63) than 87.50% of its industry peers.
Profitability Examination for NASDAQ:AXON
ChartMill's Profitability Rating offers a unique perspective on stock analysis, providing scores from 0 to 10. These ratings consider a wide range of profitability metrics and margins, both in comparison to industry peers and on their own merits. For NASDAQ:AXON, the assigned 6 is a significant indicator of profitability:
- AXON has a better Return On Assets (10.79%) than 92.19% of its industry peers.
- Looking at the Return On Equity, with a value of 20.59%, AXON belongs to the top of the industry, outperforming 92.19% of the companies in the same industry.
- With an excellent Profit Margin value of 18.01%, AXON belongs to the best of the industry, outperforming 93.75% of the companies in the same industry.
- AXON's Profit Margin has improved in the last couple of years.
- AXON's Operating Margin has improved in the last couple of years.
- AXON's Gross Margin of 59.14% is amongst the best of the industry. AXON outperforms 92.19% of its industry peers.
Why is NASDAQ:AXON a setup?
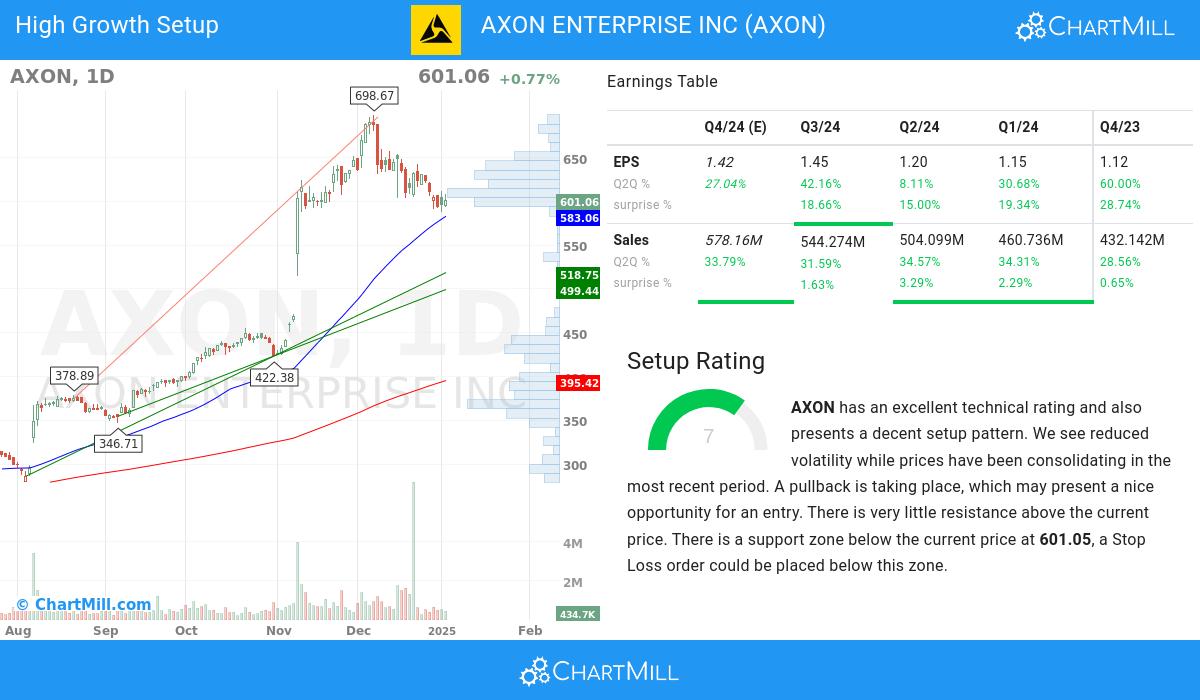
In addition to the Technical Rating, ChartMill provides a Setup Rating for each stock. This rating, ranging from 0 to 10, assesses the extent of consolidation in the stock based on multiple short-term technical indicators. Currently, NASDAQ:AXON has a 7 as its setup rating:
Besides having an excellent technical rating, AXON also presents a decent setup pattern. Prices have been consolidating lately and the volatility has been reduced. A pullback is taking place, which may present a nice opportunity for an entry. There is very little resistance above the current price. There is a support zone below the current price at 601.05, a Stop Loss order could be placed below this zone.
Every day, new Strong Growth stocks can be found on ChartMill in our Strong Growth screener.
For an up to date full fundamental analysis you can check the fundamental report of AXON
Check the latest full technical report of AXON for a complete technical analysis.
Keep in mind
Important Note: The content of this article is not intended as trading advice. It is essential to perform your own analysis and exercise caution when making trading decisions. The article presents observations created by automated analysis but does not guarantee any trading or investment outcomes. Always trade responsibly and make independent judgments.