
Broadcom Inc (NASDAQ:AVGO) Emerges as a Technical Breakout Candidate
By Mill Chart
Last update: Aug 26, 2025
Broadcom Inc (NASDAQ:AVGO) has emerged as a notable technical breakout candidate according to ChartMill's proprietary screening methodology. The screening process identifies stocks showing both solid basic technical health and consolidation patterns that indicate possible breakout chances. This two-part method helps technical investors find securities that not only show positive momentum traits but also offer good risk-reward entry points after times of price consolidation.
Technical Strength Assessment
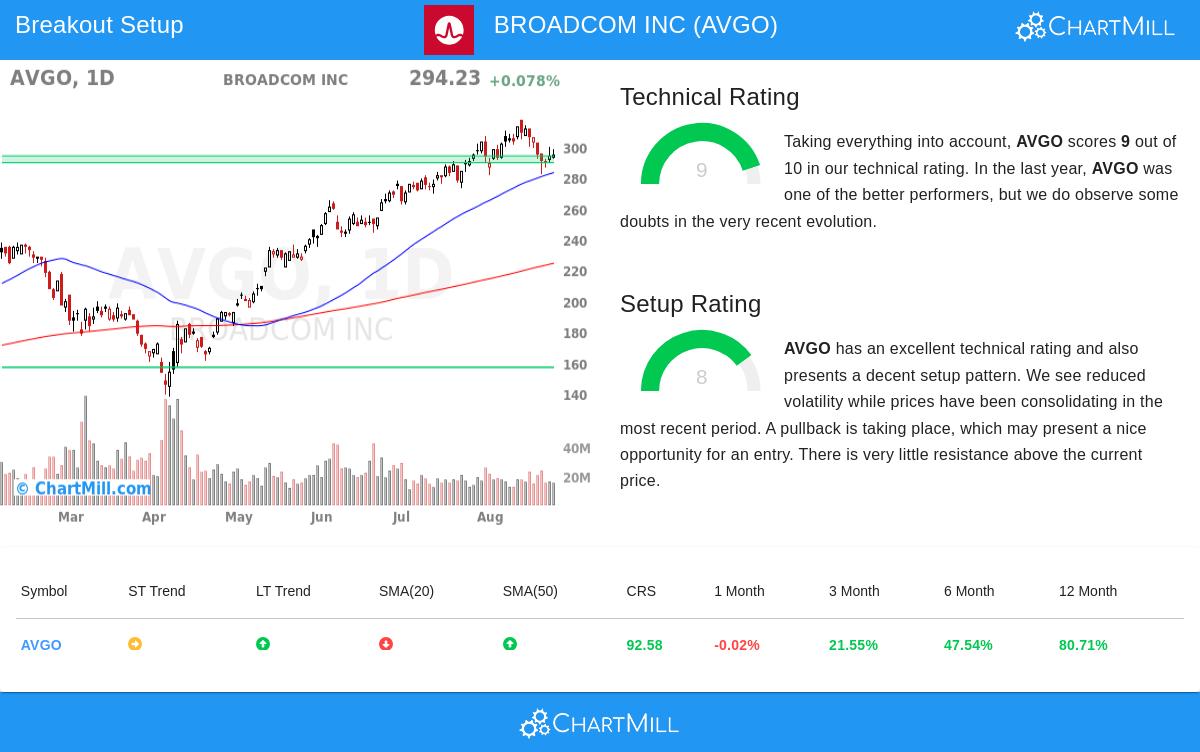
Broadcom's technical foundation seems strong, scoring a notable 9 out of 10 on ChartMill's Technical Rating system. This high rating shows several strength factors that match the screening methodology's focus on finding market leaders. The semiconductor giant shows better relative strength, doing better than 92% of all stocks over the past year with gains that have been steady throughout this time. Inside its industry group, Broadcom is in the group of top performers, doing better than 88% of semiconductor and semiconductor equipment stocks.
The long-term trend stays clearly positive, which is important for breakout strategies as they usually do best in existing uptrends. The stock holds position above important moving averages including the 50-day ($283.19), 100-day ($246.05), and 200-day ($224.53) levels, with all three averages moving upward. This moving average setup gives several support layers, a trait the screening process looks for when finding technically solid candidates.
Setup Quality Analysis
Broadcom presents a setup rating of 8, showing very good consolidation traits before possible breakout movement. The stock has been trading inside a set range between $281.61 and $317.35 over the past month, now placed in the middle of this range. This consolidation pattern is important because it allows for clear meaning of support and resistance levels, making exact entry and exit point identification possible.
Lowered volatility during this consolidation time, as shown by the narrowing price range, often comes before notable price movements. The setup analysis finds two important support zones, especially a clear support area going from $289.59 to $293.99 made by several trend lines across different timeframes. This support structure gives a logical placement for stop-loss orders, a key part of risk management in breakout trading strategies.
Trading Considerations
The technical analysis indicates a possible entry point at $300.93, placed just above the 10-day moving average, with an exit level at $289.58 below the found support zone. This setup gives controlled risk parameters with the distance between entry and exit being about 3.77% of the entry price. The Average True Range of 3.34% shows the stock's usual daily volatility, giving context for position sizing choices.
While the technical picture looks positive, investors should note that the short-term trend is now neutral, and the stock is trading in the middle of its recent range instead of at breakout extremes. This placement may need patience as the consolidation time continues before a clear move happens.
For investors looking for similar technical breakout chances, more screening results can be found through the Technical Breakout Setups screen, which finds stocks meeting both technical strength and setup quality criteria. A more in-depth technical analysis of Broadcom is available through the complete technical report.
Disclaimer: This analysis is provided for informational purposes only and should not be construed as investment advice. Technical analysis involves inherent uncertainties, and past performance does not guarantee future results. Investors should conduct their own research and consider their risk tolerance before making any investment decisions.
336.1
-3.21 (-0.95%)
Find more stocks in the Stock Screener
AVGO Latest News and Analysis


