
Our stock screener has spotted AVINO SILVER & GOLD MINES (NYSEARCA:ASM) as a stocks which checks several boxes as specified by Mark Minervini. We will dive into an analysis below.
Checking the Minervini Trend Template.
The Minervini Trend Template is a set of technical criteria designed to identify stocks in strong uptrends. We can check all the boxes for ASM:
- ✔ Relative Strength is above 70.
- ✔ Current price is within 25% of it's 52-week high.
- ✔ Current price is at least 30% above it's 52-week low.
- ✔ The current price is above the 50-, 150- and 200-day SMA price line.
- ✔ The SMA(200) is trending upwards.
- ✔ The SMA(150) is above the SMA(200)
- ✔ The SMA(50) is above the SMA(150) and the SMA(200)
Understanding ASM's High Growth Momentum Score
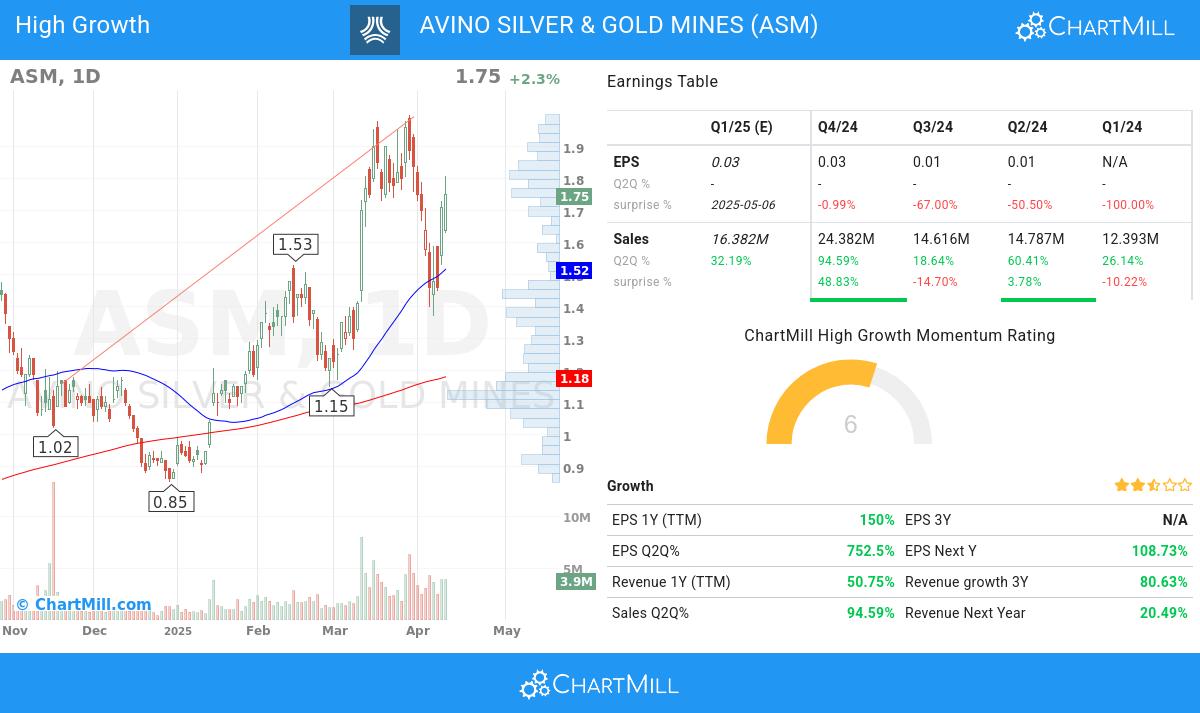
To evaluate a stock's growth potential, ChartMill utilizes a High Growth Momentum Rating (HGM) on a scale of 0 to 10. This assessment considers various growth and profitability aspects, like EPS and revenue growth, accelleration, surprises and revisions. ASM has achieved a 6 out of 10:
Explosive Earnings Growth
- ASM has demonstrated consistent growth in its earnings per share (EPS) from one quarter to another (Q2Q), with a 753.0% increase. This indicates improving financial performance and the company's effective management of its operations.
- ASM shows accelerating EPS growth: when comparing the current Q2Q growth of 753.0% to the previous quarter Q2Q growth of 183.0%, we see the growth rate improving.
- EPS acceleration happened 2 quarters in a row.
- ASM has achieved 150.0% growth in EPS over the past 12 months, reflecting a sustained improvement in earnings performance.
- ASM has demonstrated strong q2q revenue growth of 94.59%, suggesting a favorable trend in the company's financials and indicating the potential for continued expansion.
- ASM shows accelerating Sales growth: when comparing the current Q2Q growth of 94.59% to the previous quarter Q2Q growth of 18.64%, we see the growth rate improving.
- ASM has achieved significant 1-year revenue growth of 50.75%, signaling its ability to capture market opportunities and drive top-line expansion. This growth indicates the company's effective execution and its potential for continued success.
Financial Strength & Profitability
- The operating margin of ASM has seen steady growth over the past year, signaling improved profitability. This trend indicates the company's effective cost management and its ability to generate higher returns.
- In the past year ASM has expanded its Profit Margin, which demonstrates increasing profitability.
- ASM has experienced notable growth in its free cash flow (FCF) over the past year, signaling improved cash generation and strong financial performance. This growth suggests the company's ability to generate excess cash for reinvestment or shareholder returns.
- With a Debt-to-Equity ratio at 0.01, ASM showcases its prudent financial management. The company's balanced approach between debt and equity reflects its commitment to maintaining a stable capital structure.
Strong Market Performance
- ASM has maintained a healthy Relative Strength (RS) over the analyzed period, with a current 98.93 rating. This demonstrates the stock's ability to outperform its peers and indicates its competitive positioning.
Why is ASM a setup?
ChartMill also provides a Setup Rating for each stock. This rating, ranging from 0 to 10, assesses the extent of consolidation in the stock based on multiple short-term technical indicators. Currently, ASM has a 4 as its setup rating:
Although ASM has an excellent technical rating, the quality of the presented setup is not ideal at the moment. Price movement has been a little bit too volatile to find a nice entry and exit point. It is probably a good idea to wait for a consolidation first.
Check the latest full technical report of ASM for a complete technical analysis.
More like this
Our High Growth Momentum + Trend Template screen will find you more ideas which meet the Minervini criteria.
Keep in mind
This article should in no way be interpreted as advice. The article is based on the observed metrics at the time of writing, but you should always make your own analysis and trade or invest at your own responsibility.