
Uncover the potential of ABERCROMBIE & FITCH CO-CL A (NYSE:ANF) as our stock screener's choice for an undervalued stock. NYSE:ANF maintains a strong financial position and offers an appealing valuation. We'll delve into the specifics below.
Evaluating Valuation: NYSE:ANF
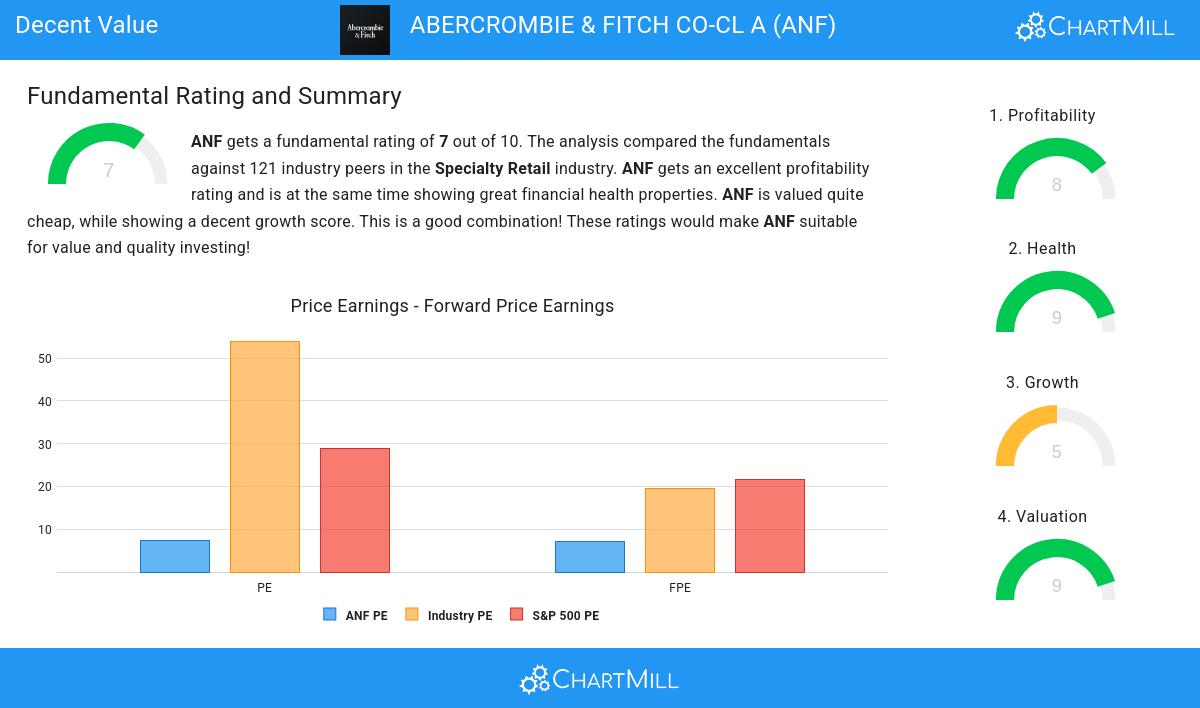
ChartMill employs its own Valuation Rating system for all stocks. This score, ranging from 0 to 10, is determined by evaluating different valuation factors, including price to earnings and free cash flow, both in absolute terms and relative to the market and industry. NYSE:ANF has earned a 9 for valuation:
- A Price/Earnings ratio of 7.31 indicates a rather cheap valuation of ANF.
- Based on the Price/Earnings ratio, ANF is valued cheaper than 90.91% of the companies in the same industry.
- When comparing the Price/Earnings ratio of ANF to the average of the S&P500 Index (28.93), we can say ANF is valued rather cheaply.
- With a Price/Forward Earnings ratio of 7.03, the valuation of ANF can be described as very cheap.
- Compared to the rest of the industry, the Price/Forward Earnings ratio of ANF indicates a rather cheap valuation: ANF is cheaper than 88.43% of the companies listed in the same industry.
- Compared to an average S&P500 Price/Forward Earnings ratio of 21.69, ANF is valued rather cheaply.
- Based on the Enterprise Value to EBITDA ratio, ANF is valued cheaply inside the industry as 94.21% of the companies are valued more expensively.
- Compared to the rest of the industry, the Price/Free Cash Flow ratio of ANF indicates a rather cheap valuation: ANF is cheaper than 90.08% of the companies listed in the same industry.
- The excellent profitability rating of ANF may justify a higher PE ratio.
Assessing Profitability for NYSE:ANF
ChartMill assigns a proprietary Profitability Rating to each stock. The score is computed by evaluating various profitability ratios and margins and ranges from 0 to 10. NYSE:ANF was assigned a score of 8 for profitability:
- ANF's Return On Assets of 16.44% is amongst the best of the industry. ANF outperforms 95.04% of its industry peers.
- ANF's Return On Equity of 43.09% is amongst the best of the industry. ANF outperforms 92.56% of its industry peers.
- ANF's Return On Invested Capital of 24.77% is amongst the best of the industry. ANF outperforms 90.91% of its industry peers.
- The last Return On Invested Capital (24.77%) for ANF is above the 3 year average (15.48%), which is a sign of increasing profitability.
- The Profit Margin of ANF (11.16%) is better than 93.39% of its industry peers.
- In the last couple of years the Profit Margin of ANF has grown nicely.
- Looking at the Operating Margin, with a value of 14.92%, ANF belongs to the top of the industry, outperforming 91.74% of the companies in the same industry.
- In the last couple of years the Operating Margin of ANF has grown nicely.
- ANF's Gross Margin of 64.66% is amongst the best of the industry. ANF outperforms 92.56% of its industry peers.
- ANF's Gross Margin has improved in the last couple of years.
ChartMill's Evaluation of Health
ChartMill assigns a proprietary Health Rating to each stock. The score is computed by evaluating various liquidity and solvency ratios and ranges from 0 to 10. NYSE:ANF was assigned a score of 9 for health:
- ANF has an Altman-Z score of 4.83. This indicates that ANF is financially healthy and has little risk of bankruptcy at the moment.
- Looking at the Altman-Z score, with a value of 4.83, ANF belongs to the top of the industry, outperforming 87.60% of the companies in the same industry.
- ANF has no outstanding debt. Therefor its Debt/Equity and Debt/FCF ratios are 0 and belong to the best of the industry.
- ANF has a better Quick ratio (0.81) than 67.77% of its industry peers.
- ANF does not score too well on the current and quick ratio evaluation. However, as it has excellent solvency and profitability, these ratios do not necessarly indicate liquidity issues and need to be evaluated against the specifics of the business.
How do we evaluate the Growth for NYSE:ANF?
ChartMill assigns a proprietary Growth Rating to each stock. The score is computed by evaluating various growth aspects, like EPS and revenue growth. We take into account the history as well as the estimated future numbers. NYSE:ANF was assigned a score of 5 for growth:
- The Earnings Per Share has grown by an impressive 73.72% over the past year.
- The Earnings Per Share has been growing by 77.89% on average over the past years. This is a very strong growth
- Looking at the last year, ANF shows a quite strong growth in Revenue. The Revenue has grown by 15.60% in the last year.
- ANF is expected to show quite a strong growth in Earnings Per Share. In the coming years, the EPS will grow by 9.01% yearly.
Our Decent Value screener lists more Decent Value stocks and is updated daily.
Our latest full fundamental report of ANF contains the most current fundamental analsysis.
Keep in mind
This is not investing advice! The article highlights some of the observations at the time of writing, but you should always make your own analysis and invest based on your own insights.