
A possible breakout setup was detected on AGNICO EAGLE MINES LTD (NYSE:AEM) by our stockscreener. A breakout pattern is formed when a stock consolidates after a strong rise up. We note that this pattern is detected purely based on technical analysis and whether the breakout actually materializes remains to be seen. It could be interesting to keep an eye on NYSE:AEM.
Zooming in on the technicals.
ChartMill assigns a Technical Rating to every stock. This score ranges from 0 to 10 and is updated daily. The score is determined by evaluating multiple technical indicators and properties.
Overall AEM gets a technical rating of 10 out of 10. Both in the recent history as in the last year, AEM has proven to be a steady performer, scoring decent points in every aspect analyzed.
- The long term trend is positive and the short term trend is neutral. The long term trend gets the benefit of the doubt for now.
- When comparing the yearly performance of all stocks, we notice that AEM is one of the better performing stocks in the market, outperforming 95% of all stocks. On top of that, AEM also shows a nice and consistent pattern of rising prices.
- AEM is one of the better performing stocks in the Metals & Mining industry, it outperforms 84% of 153 stocks in the same industry.
- AEM is currently trading in the upper part of its 52 week range. The market is still in the middle of its 52 week range, so AEM slightly outperforms the market at the moment.
- In the last month AEM has a been trading in the 94.77 - 126.75 range, which is quite wide. It is currently trading in the middle of this range, so some resistance may be found above.
For an up to date full technical analysis you can check the technical report of AEM
Looking at the Setup
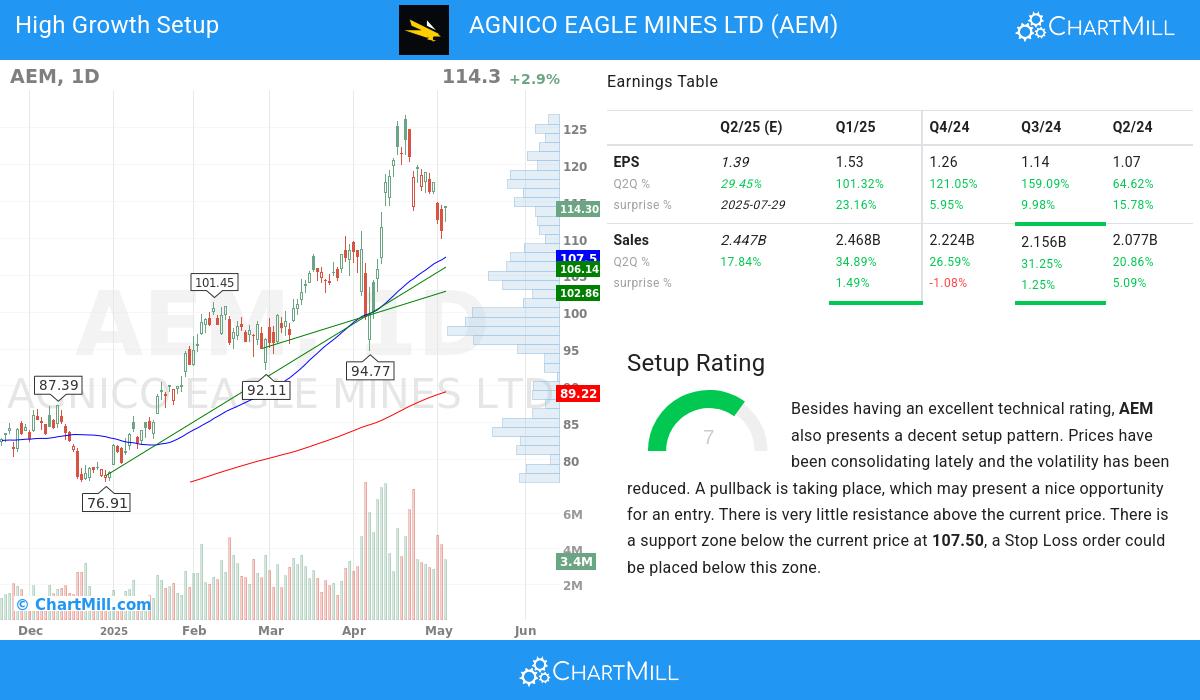
Besides the Technical Rating, ChartMill assigns a Setup Rating to every stock to determine the degree of consolidation. This rating, ranging from 0 to 10, is updated daily and evaluates various short-term technical indicators. AEM currently holds a 7 as its setup rating, suggesting a particular level of consolidation in the stock.
Besides having an excellent technical rating, AEM also presents a decent setup pattern. We see reduced volatility while prices have been consolidating in the most recent period. A pullback is taking place, which may present a nice opportunity for an entry. There is very little resistance above the current price. There is a support zone below the current price at 107.50, a Stop Loss order could be placed below this zone.
Looking into the high growth metrics of AEM
To evaluate a stock's growth potential, ChartMill utilizes a High Growth Momentum Rating (HGM) on a scale of 0 to 10. This assessment considers various growth and profitability aspects, like EPS and revenue growth, accelleration, surprises and revisions. AEM has achieved a 6 out of 10:
Earnings Momentum
- The earnings per share (EPS) of AEM have shown positive growth on a quarter-to-quarter (Q2Q) basis, with a 101.0% increase. This reflects the company's ability to improve its profitability over time.
- The 1-year EPS growth of AEM (107.0%) highlights the company's ability to consistently improve its earnings performance and suggests a positive outlook for future profitability.
- AEM has demonstrated strong quarter-to-quarter (Q2Q) revenue growth of 34.89%, reflecting its ability to generate consistent increases in sales. This growth highlights the company's effective market positioning and its potential for continued success.
- Accelerating Sales growth for AEM: the current Q2Q growth of 34.89% exceeds the previous quarter Q2Q growth of 26.59%.
- The 1-year revenue growth of AEM (28.46%) has been strong, reflecting the company's ability to generate consistent sales growth. This growth suggests the company's ability to meet customer needs and expand its market share.
- Over the past 3 months, analysts have adjusted their EPS Estimate for AEM with a 5.23% change. This highlights the evolving outlook on the company's EPS potential.
- AEM has consistently exceeded EPS estimates in the last 4 quarters, demonstrating its ability to outperform market expectations. This trend highlights the company's strong financial performance and its potential for future growth.
Financial Strength & Profitability
- With a favorable trend in its operating margin over the past year, AEM demonstrates its ability to enhance profitability through efficient operations. This growth reflects the company's focus on optimizing its cost structure.
- The free cash flow (FCF) of AEM has seen steady growth over the past year, indicating enhanced cash flow generation and financial health. This trend underscores the company's effective capital management and its ability to generate sustainable cash flows.
- With a solid Return on Equity (ROE) of 10.92%, AEM exemplifies its ability to generate favorable returns on shareholder investments. This metric demonstrates the company's commitment to maximizing shareholder value.
- A Debt/Equity ratio of 0.05 suggests that AEM is managing its debt levels responsibly.
Institutional Confidence & Market Strength
- With institutional shareholders at 70.84%, AEM demonstrates a healthy ownership distribution. This reflects a mix of institutional and individual investors, creating a market environment that may foster increased trading activity and price discovery.
- AEM has maintained a healthy Relative Strength (RS) over the analyzed period, with a current 95.94 rating. This demonstrates the stock's ability to outperform its peers and indicates its competitive positioning.
More high growth momentum breakout stocks can be found in our High Growth Momentum Breakout screen.
Keep in mind
This is not investing advice! The article highlights some of the observations at the time of writing, but you should always make your own analysis and invest based on your own insights.