
ADMA BIOLOGICS INC (NASDAQ:ADMA) was identified as a Technical Breakout Setup Pattern by our stockscreener. Such a pattern occurs when we see a pause in a strong uptrend: after a strong rise the stock is consolidating a bit and at some point the trend may be continued. Whether this actually happens can not be predicted of course, but it may be a good idea to keep and eye on NASDAQ:ADMA.
Technical analysis of ADMA
ChartMill assigns a Technical Rating to every stock. This score, ranging from 0 to 10, is updated daily and is determined by evaluating multiple technical indicators and properties.
Overall ADMA gets a technical rating of 10 out of 10. Both in the recent history as in the last year, ADMA has proven to be a steady performer, scoring decent points in every aspect analyzed.
- The long and short term trends are both positive. This is looking good!
- Looking at the yearly performance, ADMA did better than 99% of all other stocks. On top of that, ADMA also shows a nice and consistent pattern of rising prices.
- ADMA is one of the better performing stocks in the Biotechnology industry, it outperforms 98% of 568 stocks in the same industry.
- ADMA is currently trading in the upper part of its 52 week range. The market is still in the middle of its 52 week range, so ADMA slightly outperforms the market at the moment.
- In the last month ADMA has a been trading in the 16.51 - 22.25 range, which is quite wide. It is currently trading near the high of this range.
- Volume is considerably higher in the last couple of days.
Check the latest full technical report of ADMA for a complete technical analysis.
Looking at the Setup
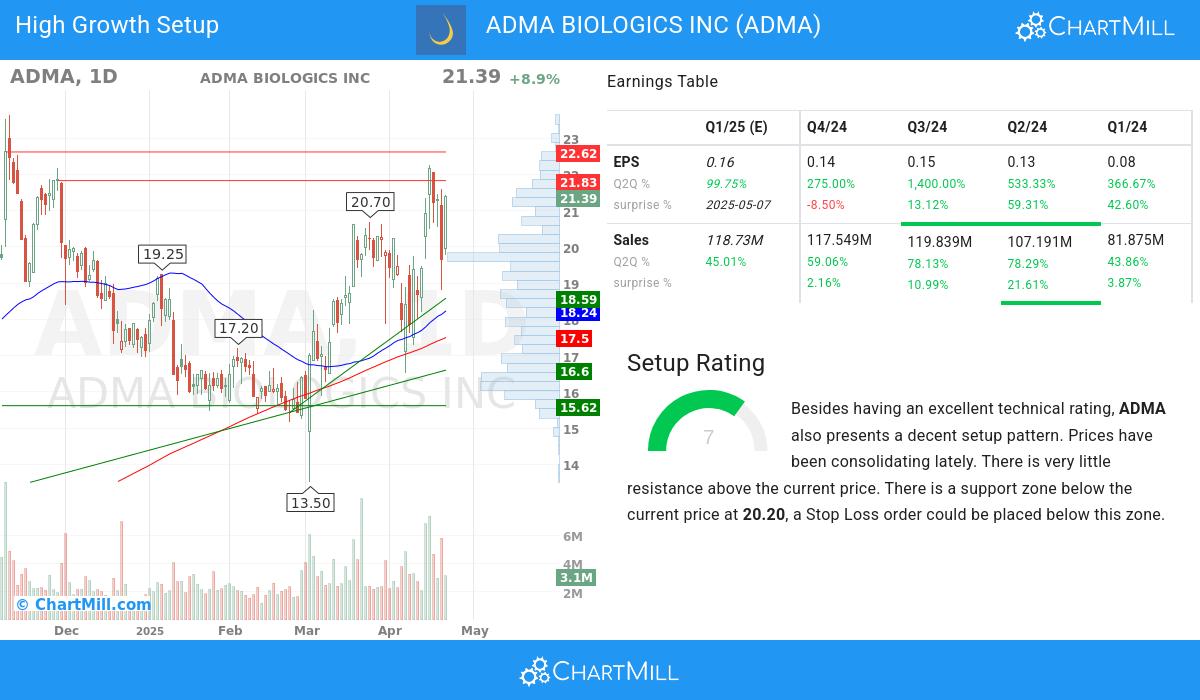
In addition to the Technical Rating, ChartMill provides a Setup Rating for each stock. This rating, ranging from 0 to 10, assesses the level of consolidation in the stock based on multiple short-term technical indicators. Currently, ADMA has a 7 as its setup rating, indicating its current consolidation status.
ADMA has an excellent technical rating and also presents a decent setup pattern. Prices have been consolidating lately. There is very little resistance above the current price. There is a support zone below the current price at 20.20, a Stop Loss order could be placed below this zone.
Why we can consider ADMA a High Growth Stock.
ChartMill assigns a proprietary High Growth Momentum Rating (HGM) to each stock. The score is computed by evaluating various growth and profitability aspects aspects, like EPS and revenue growth, accelleration, surprises and revisions. ADMA was assigned a score of 7 for growth:
Explosive Earnings Growth
- The EPS of ADMA has exhibited growth from one quarter to another (Q2Q), with a 275.0% increase. This underscores the company's ability to generate higher earnings and improve its financial standing.
- Over the past year, ADMA has demonstrated 485.0% growth in EPS, signifying its positive financial trajectory and potential for future profitability.
- The recent q2q revenue growth of 59.06% of ADMA showcases the company's ability to generate increasing revenue in a short period, reflecting its positive growth trajectory.
- The 1-year revenue growth of ADMA (65.16%) has been strong, reflecting the company's ability to generate consistent sales growth. This growth suggests the company's ability to meet customer needs and expand its market share.
- ADMA has surpassed EPS estimates 3 times in the last 4 quarters, reflecting its strong financial performance and effective management. This trend suggests the company's ability to generate positive earnings surprises and drive shareholder value.
Profitability & Financial Strength
- With a favorable trend in its operating margin over the past year, ADMA demonstrates its ability to enhance profitability through efficient operations. This growth reflects the company's focus on optimizing its cost structure.
- With a favorable trend in its free cash flow (FCF) over the past year, ADMA demonstrates its ability to generate robust cash flows and maintain financial stability. This growth reflects the company's focus on efficient capital allocation and cash management.
- The Return on Equity (ROE) of ADMA stands at 56.64%, reflecting the company's strong profitability and effective utilization of shareholder equity. This metric signifies the company's ability to generate returns for its investors.
- With a Debt-to-Equity ratio at 0.21, ADMA showcases its prudent financial management. The company's balanced approach between debt and equity reflects its commitment to maintaining a stable capital structure.
Market Strength & Institutional Confidence
- With institutional shareholders at 88.05%, ADMA demonstrates a healthy ownership distribution. This reflects a mix of institutional and individual investors, creating a market environment that may foster increased trading activity and price discovery.
- ADMA has maintained a healthy Relative Strength (RS) over the analyzed period, with a current 99.12 rating. This demonstrates the stock's ability to outperform its peers and indicates its competitive positioning.
Our High Growth Momentum Breakout screen will find you more ideas suited for high growth momentum breakouts.
Disclaimer
This is not investing advice! The article highlights some of the observations at the time of writing, but you should always make your own analysis and invest based on your own insights.