
TRADERS – Market Dynamics (part 2)
Published on Chartmill with kind permission of TRADERS’ Magazine. Check the original PDF article here
Physics laws shape the world we live in. Most of the observations we make, how we function as organisms as well as practically all biological processes are, in effect, tuned in harmony with these universal forces. There’s no escaping them and today’s most successful species have learned to use them to their advantage. In financial markets too, there are underlying forces an investor or trader has to know and needs to respect in order to be successful. This article series aims at exposing the underlying forces driving market dynamics while detaching them from their protruding visible consequences that are way better known to traders.
In the previous article we showed how gravity and capacity are two of financial markets’ strong underlying forces. In this article we’ll elaborate on the powerful law of nature in the financial markets, how it appears in different spots in their dynamics, effecting participants and what markets keep in store for them.
Less Drives More
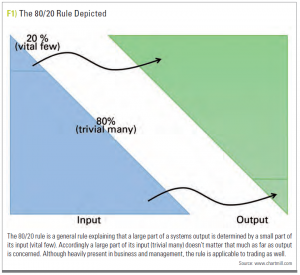
Most people are familiar with the 80-20 rule, also named the Pareto principle or Juran’s principle, known furthermore as the law of the vital few (and trivial many), sometimes described as factor sparcity. This rule, although more an empirical observation than a true law of nature, states that roughly 80 per cent of effects (output) come from 20 per cent of the causes (input), as depicted in Figure 1. Nowadays it’s even common to see it pop up under denominators such as power laws (giving rise to Pareto type distributions), long tail economics with a lot of attention towards areas like rupture dynamics. We won’t go there in this article.
Although the numbers 80 and 20 are used, in trying to grasp the main point, one shouldn’t focus on them for two reasons. First of all, they don’t have to be exactly 80 and 20, they can be numbers describing minority versus majority. Secondly, they don’t have to add up to a hundred, even though they are expressing percentages. The reason for that being they describe totally different things. So this commonly observed effect might show itself as 17 per cent of causes accounting for 91 per cent of the effects (91 and 17 not adding up to a neat 100). What this rule is actually saying is that most things in life aren’t distributed evenly. As a consequence not all efforts have the same or even proportional impact on the outcome of what it is we try to achieve (return in the case of trading).
Lastly, don’t think the Pareto Principle means only 20 per cent of the work needs to be done (if one is satisfied with 80 per cent of the result). It may be true that 80 per cent of a bridge is built in the first 20 per cent of the time, but you still need the rest of the bridge in order for it to work. It may be true that 80 per cent of the Mona Lisa was painted in the first 20 per cent of the time, but it wouldn’t be the masterpiece it is without all the details. So this principle is mostly useful in situations where we don’t seek perfection but want to optimise our bang for the buck. In those cases, focusing on the critical 20 per cent is a time and energy saver. See what activities generate the most results and give them your appropriate attention.
Market Application
Can we find the 80-20 rule in financial markets? For sure, we can. Numerous studies show how the minority of (hedge) funds earn the majority of alpha, how the majority of stock movements happen in the minority of time, how the minority of stocks make for the majority of the action. But all these studies are looking at power laws from the viewpoint of the market. In this article we want to zoom in on how 80- 20 can make a difference for the individual trader.
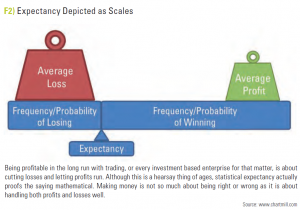
Let’s start with some root cause analysis on profitability. In trading profitability comes from the combination of frequency and size of wins and losses (see Figure 2). And no matter how much the financial industry makes its customers focus on the number of winners (having more winners), we have far more control over the size of wins and losses (just by selling – if you sell each position at a five per cent loss, your average loss can never get bigger than five per cent).
This is where an interesting deduction can be made. For if we need to focus on cutting losses (minimising the average loss) while maximising the average winner to be profitable in the long run, profitable traders will on average have few large winners (the vital few) and lots of small losses (the trivial many). There you have it, 80-20 in one’s trades. But it doesn’t stop there. If we take this a bit further, 20 per cent of ones trades will also represent 80 per cent of one’s profits.
There’s a conservational law stating that the money flux must be constant (we won’t consider money being printed or destroyed because on an individual scale it doesn’t matter much). Furthermore at any time market dynamics will follow the path of least resistance. It is easiest to pay off the smallest group. So if winners on average have big positions, chances are that there are more people losing at any one time. If there would be more winners than losers, their positions couldn’t be larger. If the number of winners and losers would be equal, markets would on average be nothing more than breaking even. From this it must follow that, on average, any trader can expect to have more losing trades than winning trades in the long run. 80-20 time and again. 80- 20 among traders. The ‘on average’ here implies that it don’t have to be the same people winning every time. But for each stand-off, there will be a power law distribution between winners and losers in the market. With some caution one might start to wonder if that would mean that on average 20 per cent of traders gets away with 80 per cent of the money on a lager time scale.
What about Analysis
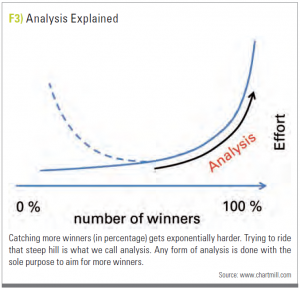
Take a look at Figure 3. If we wonder how getting from zero per cent losers towards 100 per cent relates to the effort to get there, some things are pretty obvious. First, no one can have 100 per cent winners, for that would implicate that someone being able to see the future. If such a system would exist, markets would become obsolete very quickly.
Since we can’t get to 100 per cent, the relationship can’t possibly be linear. So even though we don’t know how the relationship looks like, it must be asymptotic to the vertical line at 100 per cent and it must increase towards the right for less effort won’t get us more winners. Climbing that slope is what we call analysis, because the sole purpose of any type of analysis is getting us more winners. Therefore getting from 30 to 40 per cent winners might take some effort (energy/time/ money for analysis), trying to get from 40 to 50 per cent will cost us several times that effort. This is a power law, showing that, although analysis might not be futile, it obeys a law of diminishing returns. To put this in another way: We probably do way too much analysis. We should focus on 20 per cent of the simplest analysis (like relative strength) which will get us the most value/effect.
Before you know it you are spending lots of time on the minor details (like reading everything through what fundamental analysis has to offer). Analysis doesn’t have to be perfect but good enough, the rest can be left to execution. Focus your effort on the 20 per cent that makes a difference, instead of the 80 per cent that doesn’t add much. Again with caution we can start to wonder if 20 per cent of analysts produce 80 per cent of total analysis value.
System Quality
To take this away. What holds for a trader can easily be transposed on a trading system. A system probably will earn 80 per cent of its money in 20 per cent of its time/trades. So on average a system probably will be out of synch with the market the majority of its time and 20 per cent in synch. To separate both phases one could do equity curve analysis on a system. If its equity curve goes down, money is taken away from the system but it keeps paper trading while being monitored. If its (now paper) equity curve starts going up, the system is put back on live trading modus.
As far as a portfolio is concerned, lots of research is done and it would takes us way to far even just by giving an overview here. But a great place to start would be comparing what is called the Pareto efficient frontier with the efficient frontier in modern portfolio theory.
Conclusion
80/20 is a great decision making technique in general but in the financial markets it might be lurking around every corner of trading activity. Pay attention to it and always keep the big picture in mind while taking care of each individual trade. «