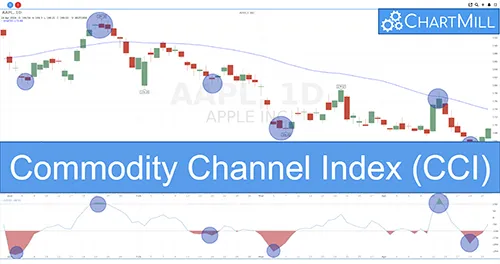
Mastering Market Momentum: The Commodity Channel Index (CCI)
The Commodity Channel Index (CCI) is a versatile momentum-based technical indicator used to measure the variation of a financial instrument's price from its statistical mean. It helps traders identify overbought or oversold conditions in the market.
The CCI compares the current price level to an average price level over a specific period of time, typically 20 or 14 periods. Traders use CCI to spot potential trend reversals, divergences, and to confirm buy or sell signals generated by other indicators.
It was developed by Donald Lambert, a technical analyst who originally published the indicator in Commodities magazine (now Futures) in 1980. The indicator is widely used by traders and investors in various financial markets, including stocks, commodities, and forex.
The CCI Formula
CCI= (0.015*Mean Deviation) / (Typical Price - Simple Moving Average)
Calculating The CCI
To calculate the CCI, follow these steps:
- Calculate the Typical Price using the formula: (High + Low + Close) / 3
- Calculate the Simple Moving Average (SMA) of the Typical Prices over a specified period
- Calculate the Mean Deviation, which is the average of the absolute differences between each Typical Price and the SMA
- Plug the values into the CCI formula to get the final result.
What Does the Commodity Channel Index Tell You?
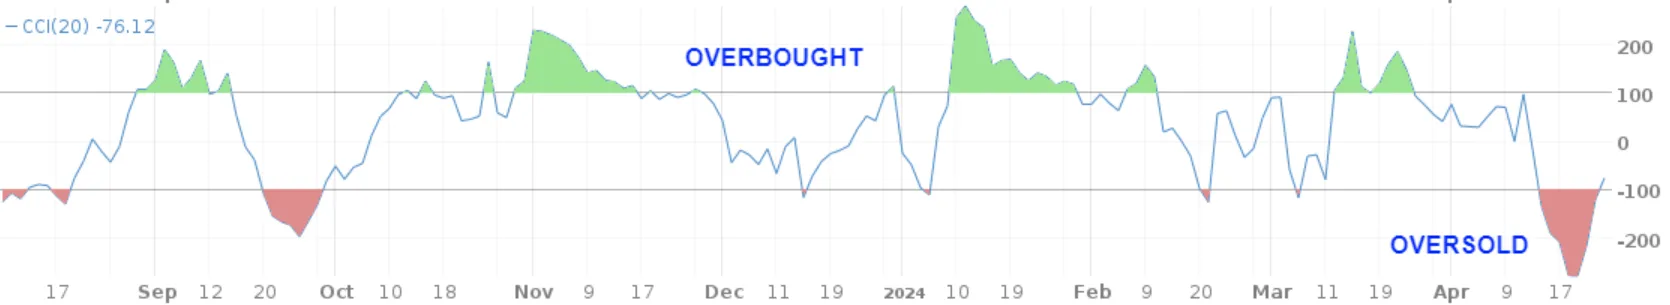
Overbought and Oversold Levels
The Commodity Channel Index helps traders identify potential buy or sell signals based on overbought or oversold conditions. When the CCI rises above +100, it indicates overbought conditions, suggesting a potential sell signal.
Conversely, when the CCI falls below -100, it suggests oversold conditions, signaling a potential buy opportunity.
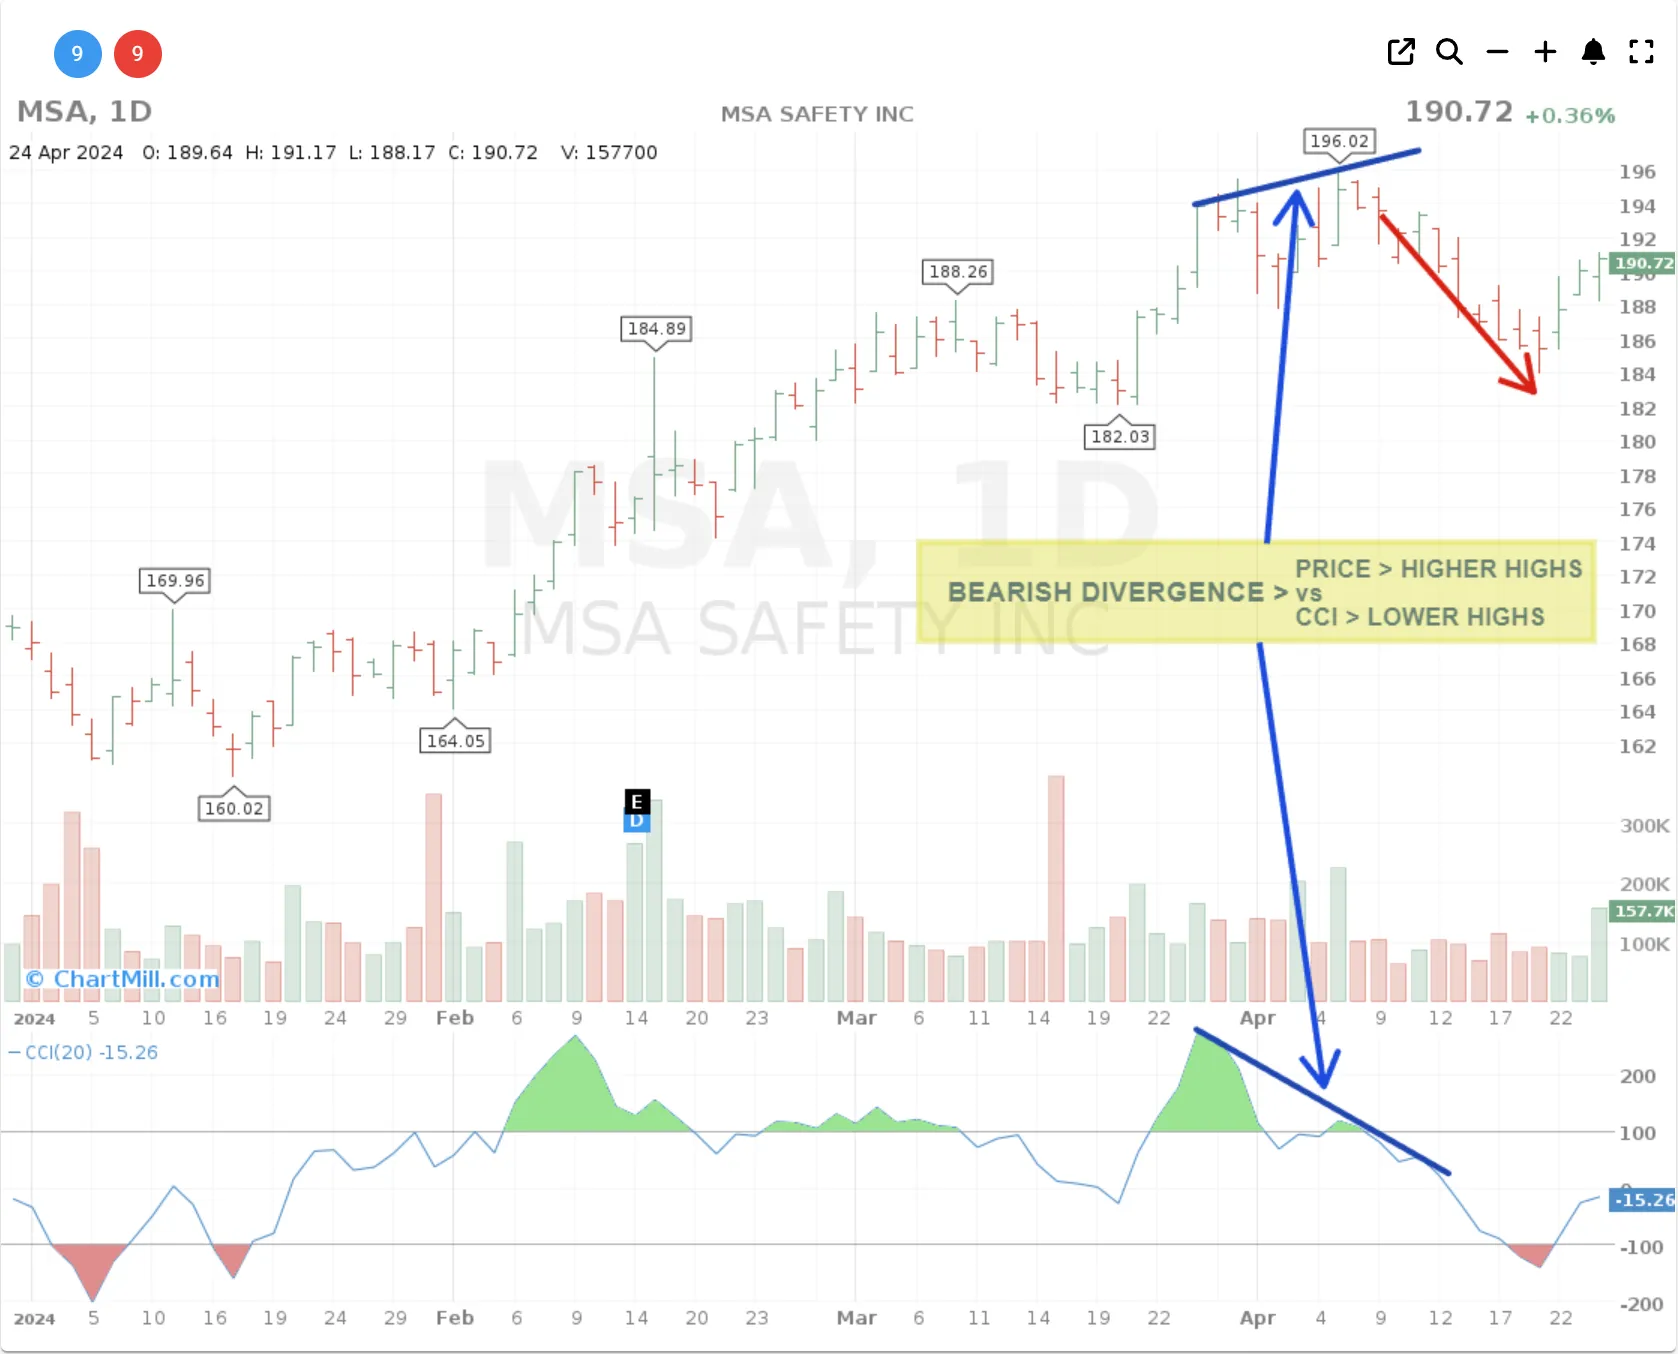
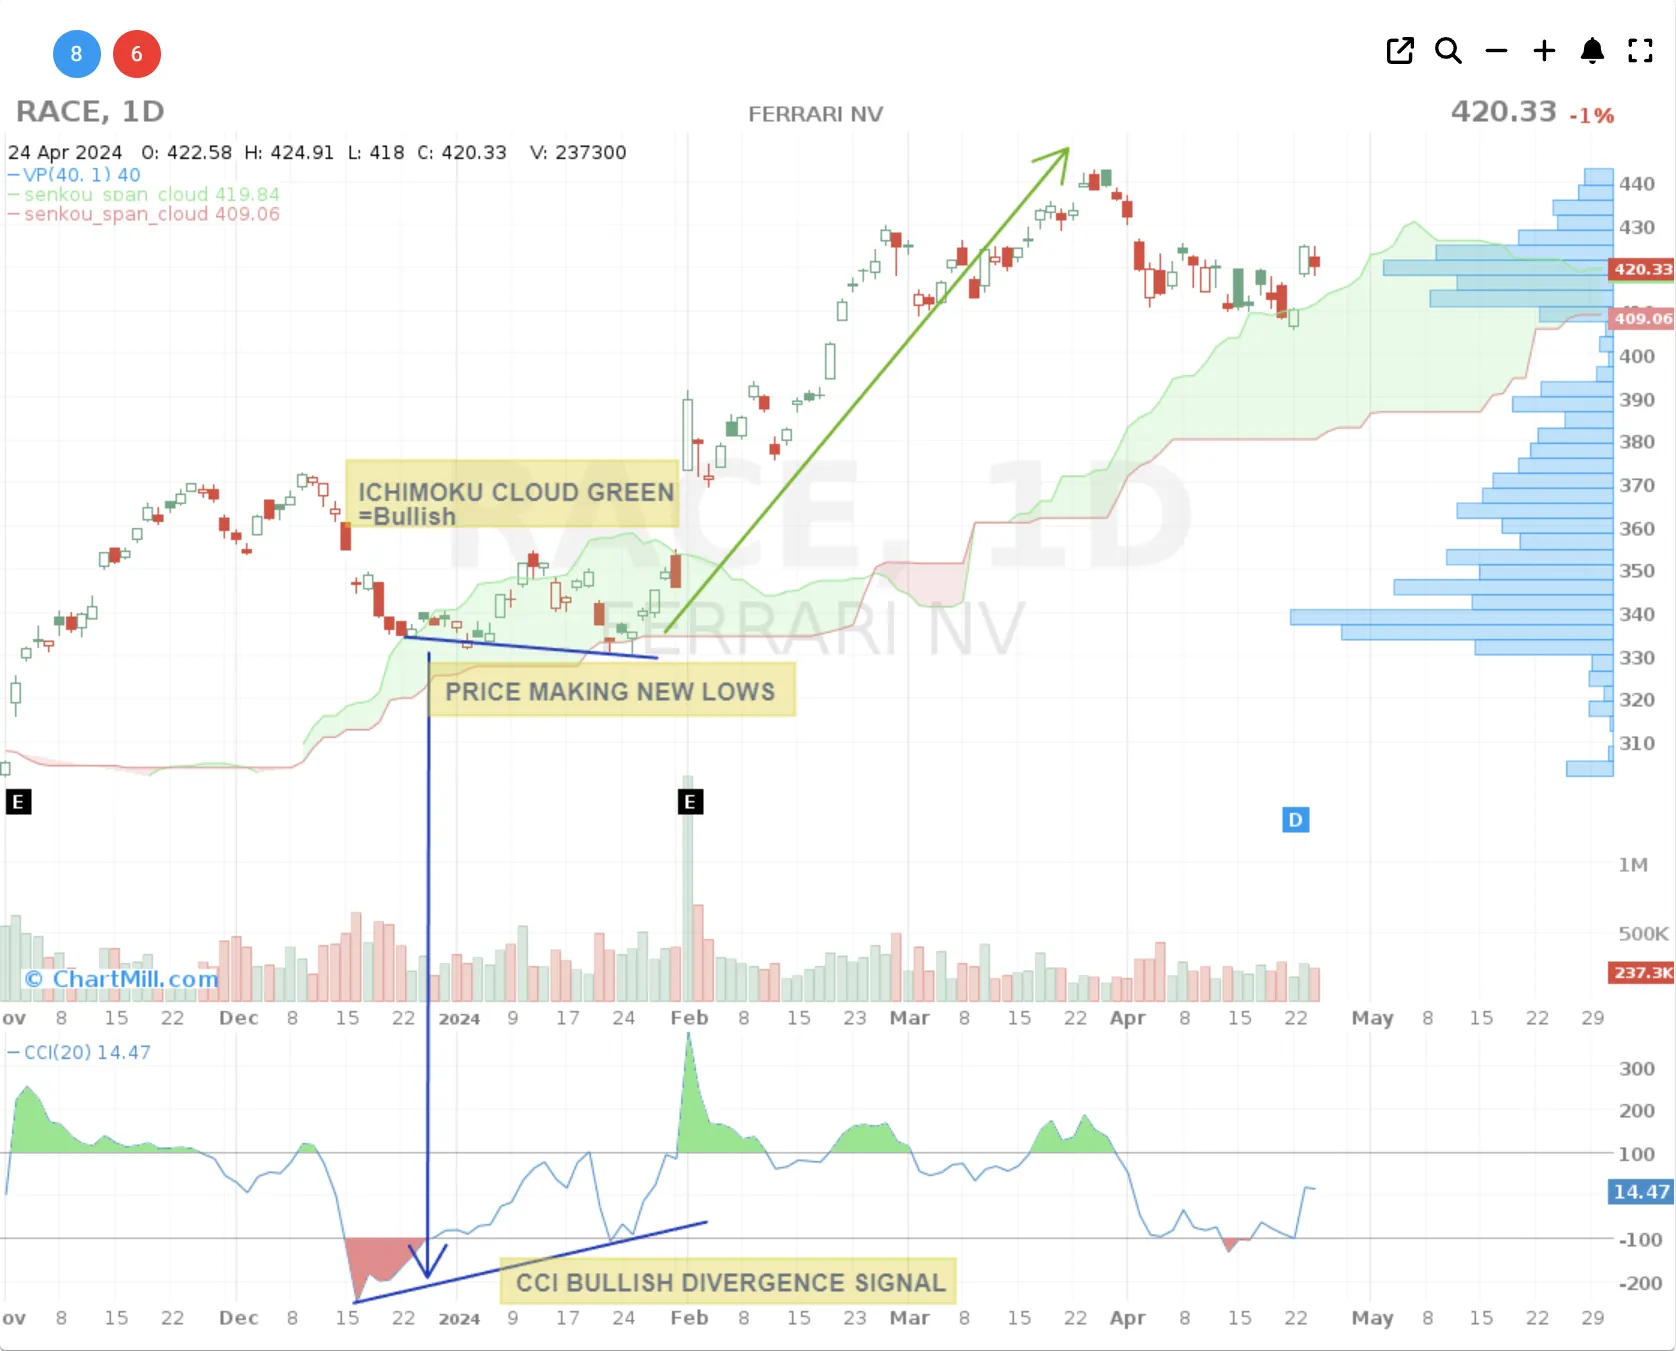
Bullish & Bearish Divergence Signals
Bullish and bearish divergences occur when the price of an asset moves in the opposite direction of the CCI indicator. A bullish divergence happens when the price makes a lower low, but the CCI makes a higher low, indicating potential upward momentum.
Conversely, a bearish divergence occurs when the price makes a higher high, but the CCI makes a lower high, signaling potential downward momentum.
Limitations of Using the Commodity Channel Index
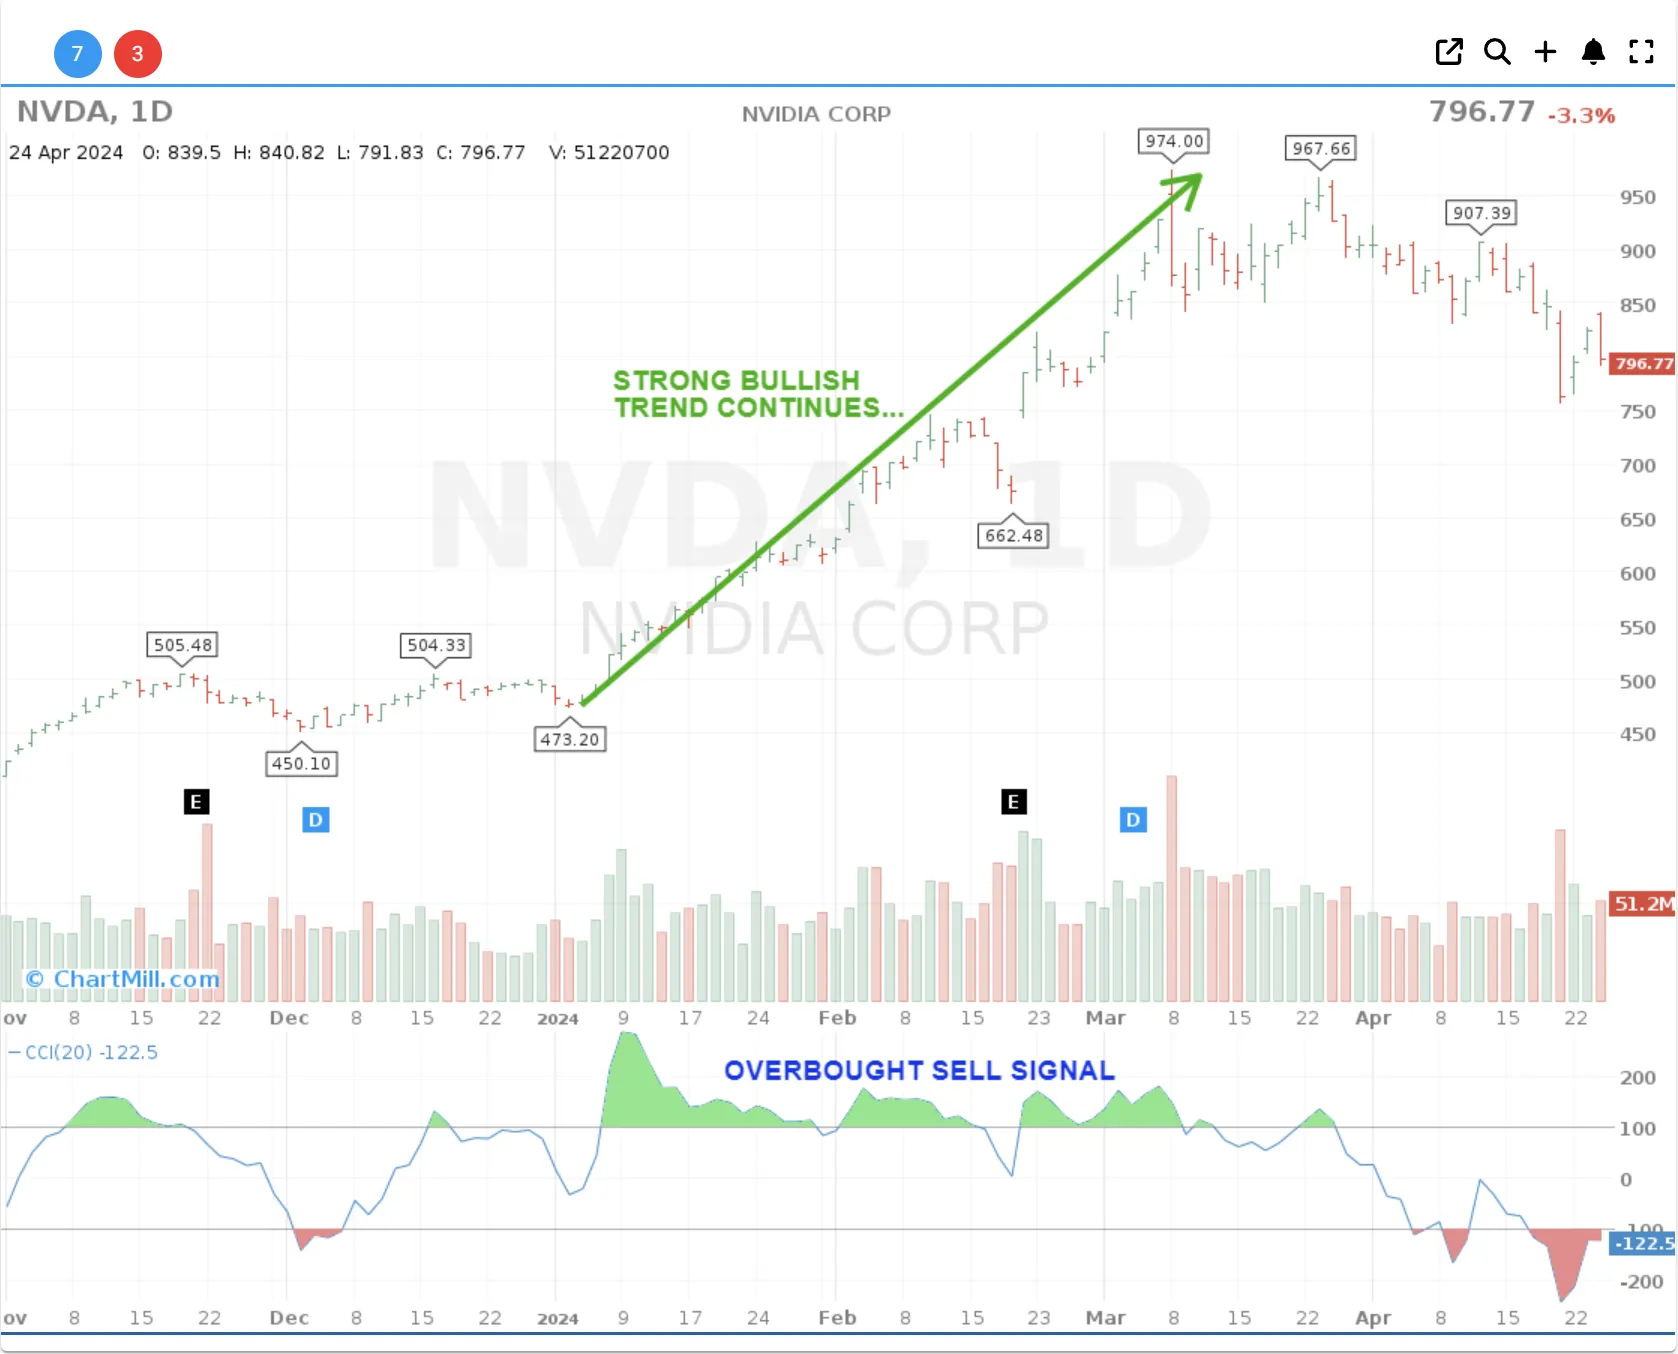
While the Commodity Channel Index can be a valuable tool for identifying overbought or oversold conditions and potential trend reversals, it is not without its limitations. One limitation is that the CCI can (and will!) generate false signals during strong trending markets.
How To Use CCI in a Trading Strategy?
Like any technical indicator, the CCI is not foolproof and should be used in conjunction with other analysis tools for more reliable trading decisions. Confirmation is always needed from other elements on the chart in conjunction with the indicator's buy or sell signal. The more converging elements occur, the more reliable the signal becomes. Here are some clear examples.
CCI oversold, longterm trend bullish, retesting the SMA50
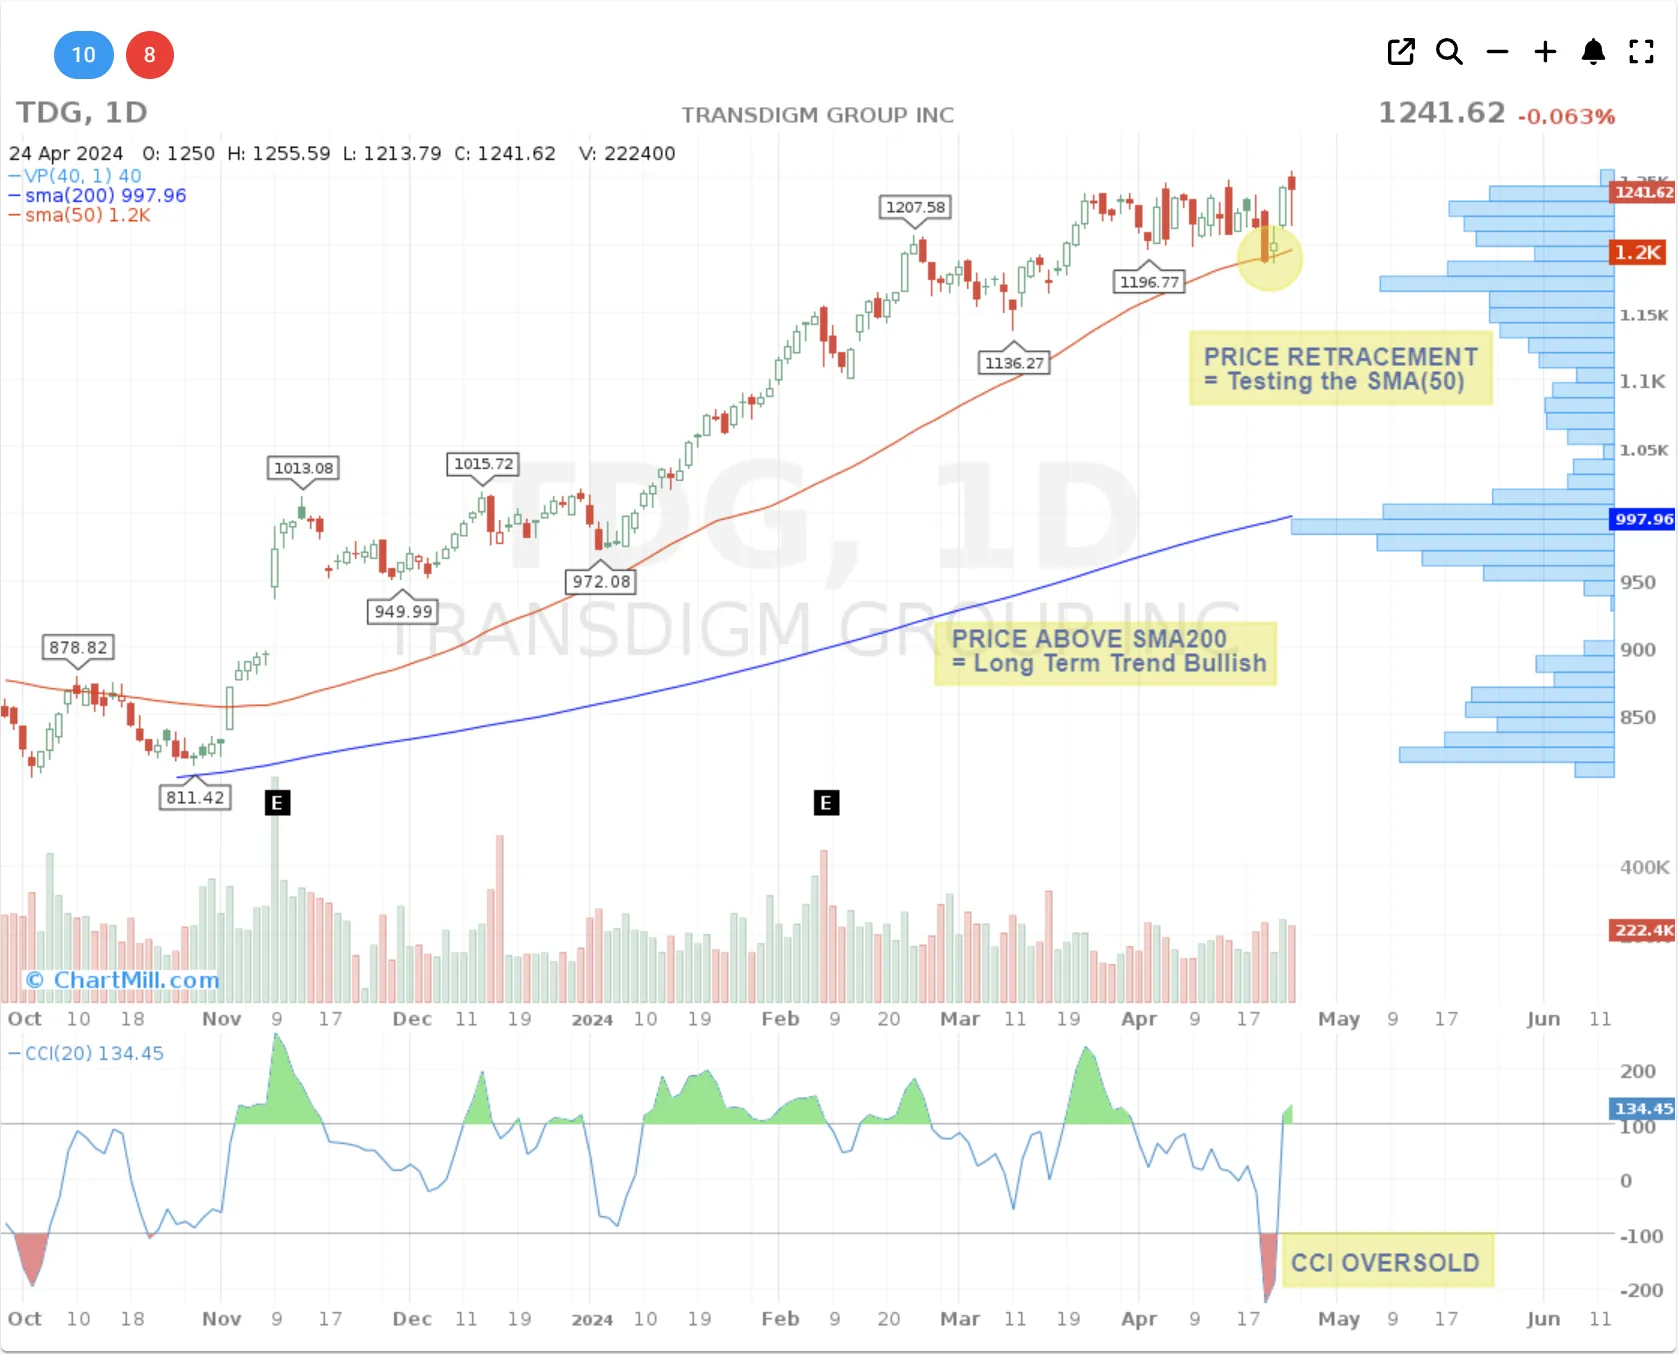
Trading only in the direction of the existing long-term trend ensures that we ignore all "sell signals" from the CCI indicator. That way, a lot of false signals can be avoided as shown on the chart above.
CCI overbought, longterm trend bearish, Ichimoku Cloud bullish
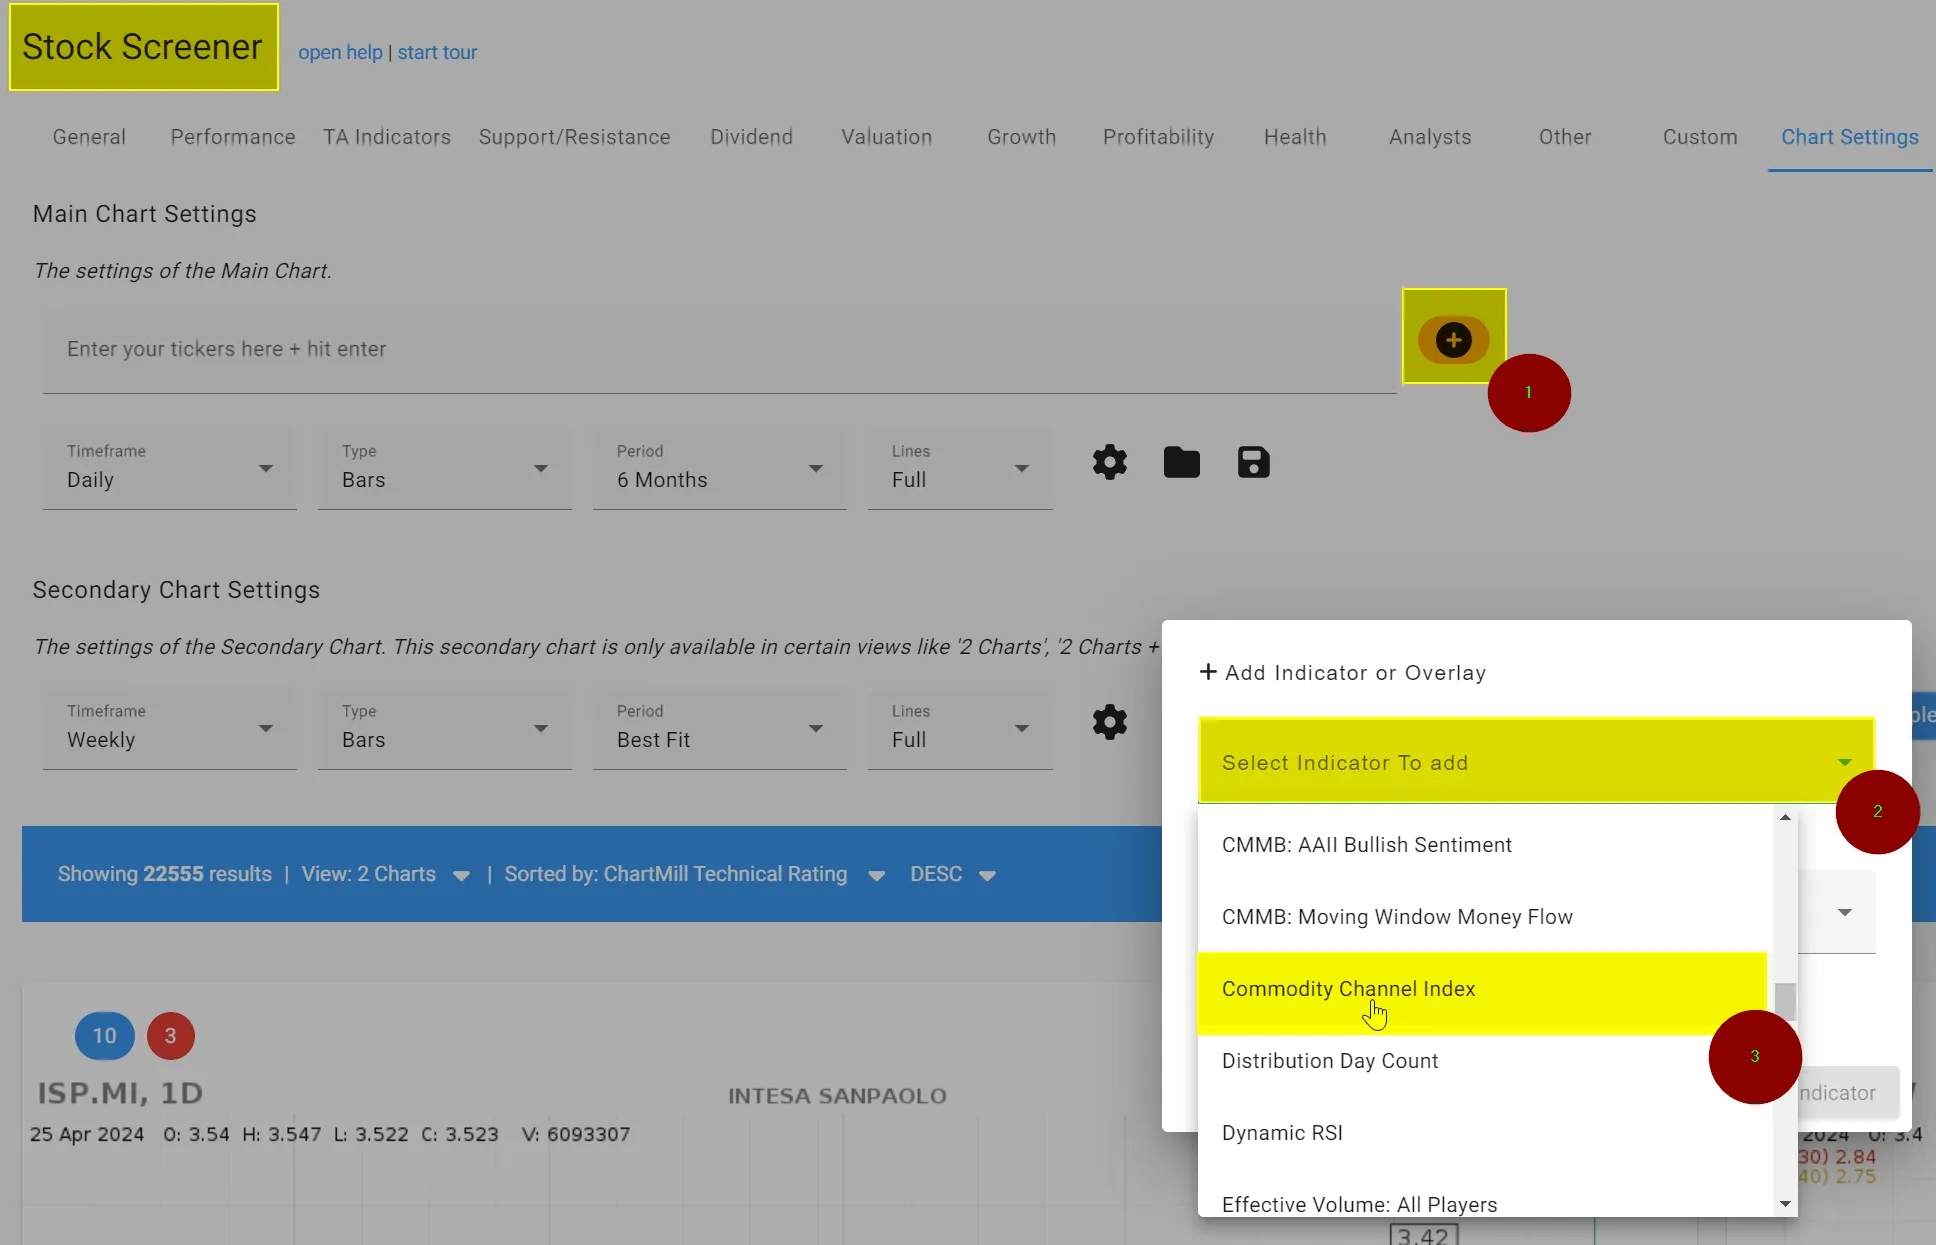
Using the indicator in ChartMill
The CCI is available in ChartMill and can be added as an indicator on the charts either through the stock charts or the stock screener page.
Books regarding the CCI indicator
"New Concepts in Technical Trading Systems" by J. Welles Wilder Jr. - This classic book introduces the Commodity Channel Index along with other technical indicators and trading systems.
"Technical Analysis of the Financial Markets: A Comprehensive Guide to Trading Methods and Applications" by John J. Murphy - This book covers various technical analysis tools, including the CCI, and provides practical insights into applying them in trading strategies.
"The Encyclopedia of Technical Market Indicators" by Robert W. Colby and Thomas A. Meyers - This comprehensive reference guide includes detailed explanations and examples of the Commodity Channel Index and other technical indicators used in financial markets.