Accumulated Volume Indicator
The indicator ‘Accumulated Volume’ is available in our stock charts. It displays the total volume over an interval and uses two parameters:
- Start of the interval, measured in number of candles from the right side of the chart (thus pinpointing the left side of the interval).
- Length of the interval as a number of candles.
The value of the indicator gives the total volume over the defined interval. The visual representation is a histogram.
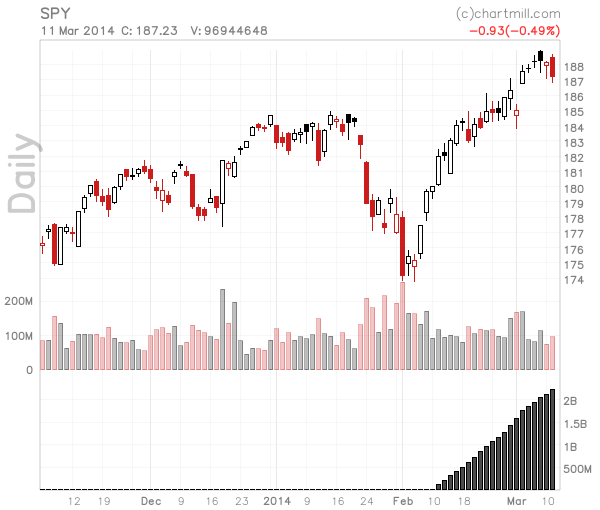
The accumulated volume over an interval can be valuable in measuring the length (in number of shares traded) during an accumulation phase or channel such as the Chartmill Channels.
You can find an example chart here:
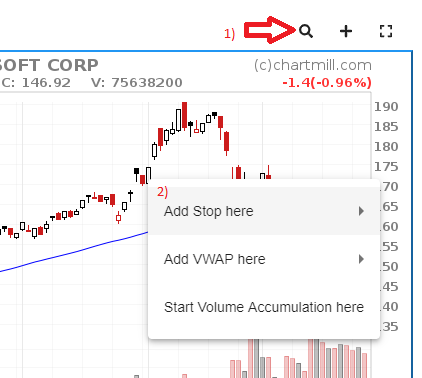
Anchored Indicators can be added from the chart
The ‘Accumulated Volume’ is a so called anchored indicator. Anchored indicators have a parameter that indicates on which candle the indicator needs to anchored. For ease of use you can add these indicators on the chart itself by just pointing at the candle where you want to anchor it to. This can be done by:
- Click the inspect icon above the chart to enable candle details while you hover over the chart.
- Find the candle where you want to anchor an indicator to, right click and select the desired indicator.