Three White Soldiers Candlestick Pattern: Unveiling the Power of this Bullish Reversal Pattern
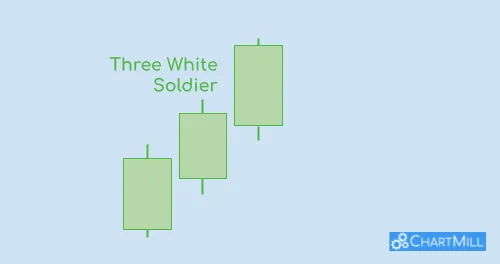
The Three White Soldiers pattern is a bullish reversal pattern that signifies strong buying pressure and positive price action in the market. It consists of three consecutive candlesticks with each one opening below the previous day's close (or to put it another way; within the body of the previous candle) but then closing above it.
The open price for each day should be within the range of the previous day's real body, and there should be little or no upper wick on each candlestick. The closing price for each day should also be near its high point, indicating strong buying pressure throughout the day.
Importance of Identifying the Pattern in Technical Analysis
Identifying this pattern can be an important tool for technical analysts as it can indicate a potential shift in market sentiment from bearish to bullish. It provides a clear signal to traders that there may be an opportunity to enter into long positions as buyers have taken control and are pushing prices higher.
Additionally, this pattern can be used in conjunction with other technical indicators such as volume and moving averages to increase its accuracy and strength as a trading signal. By identifying this pattern early on, traders can capitalize on potential gains while minimizing risk by setting stop-loss orders at appropriate levels.
Description of the Pattern and Its Characteristics
It all starts with a long bullish candlestick, followed by two more bullish candlesticks that open within the previous day's trading range. Each successive candlestick should close higher than the previous day's close, creating an upward trend. Importantly, each candlestick should also have little or no upper shadow, indicating that buyers were able to maintain control throughout most of the trading session.
This pattern typically forms after an extended downtrend or period of consolidation, indicating that sellers are losing momentum and buyers are beginning to take control. The formation of this pattern is often seen as a strong signal to buy because it indicates that buyers are likely to continue pushing prices higher for some time.
This pattern can occur on daily, weekly, and monthly charts as well as intraday charts. The longer the time frame, the more reliable the pattern becomes since it shows a more extended period of sustained buying pressure.
Anatomy of the Three White Soldiers
The first candlestick
The first candlestick in the pattern should have a long body, small wicks, and be close to its high. This first white soldier represents an initial buying pressure from bulls shifting market sentiment from bearish to neutral or slightly bullish.
The second candlestick
This one should also have a long body with no or small upper wick and close higher than the first day's close. The bullish sentiment carries over into the second white soldier as buyers continue pushing prices higher.
The third candlestick
The third one should be similar to the second one with a long body and no or small upper wick, closing higher than both previous days' closes. Buyers are firmly in control as they push prices even higher.
Price gaps may occur between any two days within this pattern, but they are not required for it to form correctly. It is essential to note that each subsequent day's close must be above its opening price for this pattern to be valid.
Psychology Behind This Pattern
The formation of three white soldiers suggests that bulls have taken control after an extended downtrend or period of consolidation. Buyers are increasing their positions at progressively higher prices as they become more confident in their ability to push prices up even further.
This buying pressure can create a sense of urgency for traders who may feel like they are missing out on an opportunity if they don't buy now. Fear of missing out (FOMO) can drive prices up further, creating a self-fulfilling prophecy as more buyers enter the market, pushing prices higher and validating the pattern.
What Causes This Bullish Reversal Pattern to Form?
The pattern forms when there is a shift in market sentiment from bearish to bullish. This shift can be caused by any number of factors, including positive news about the company or industry, an unexpected earnings report, or a change in market conditions that favor the stock.
It’s important to note that this pattern works best in markets with high liquidity and low volatility since it requires significant buying pressure to push prices higher. When there is low trading volume or high volatility, false signals can occur as traders try to take advantage of price swings.
Using The Three White Soldiers Pattern in a Trading Strategy - Two Examples
Example 1: After a pullback in a rising trend
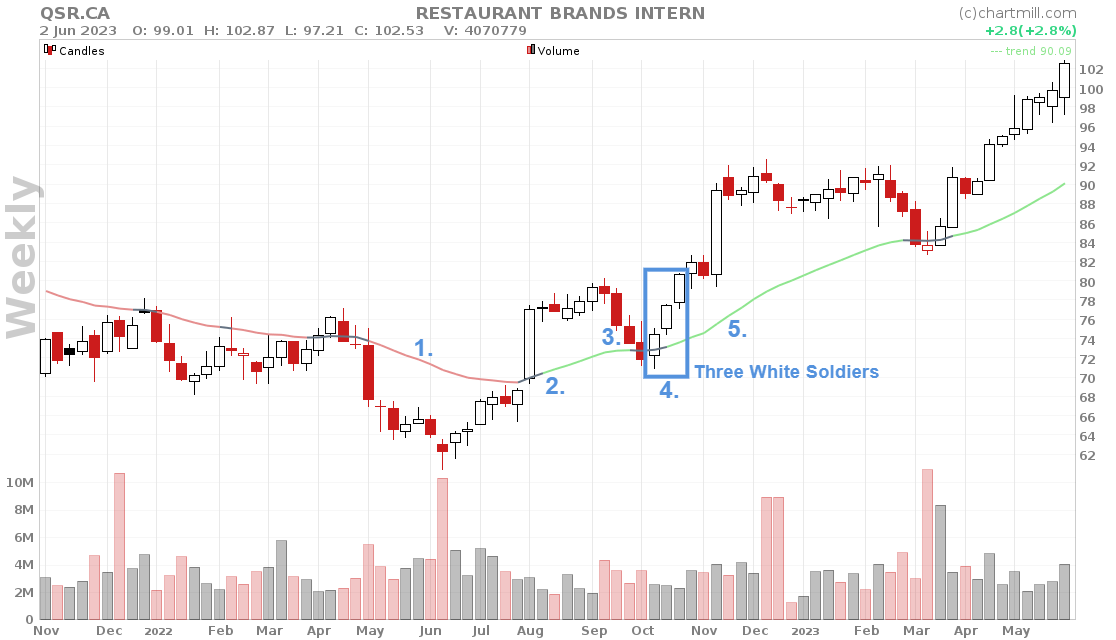
- Long-term trend is down
- Trend becomes bullish
- Pull back in an uptrend
- Three White Soldiers pattern appears
- Continuation of the bullish trend
Example 2: At the beginning of a trend reversal
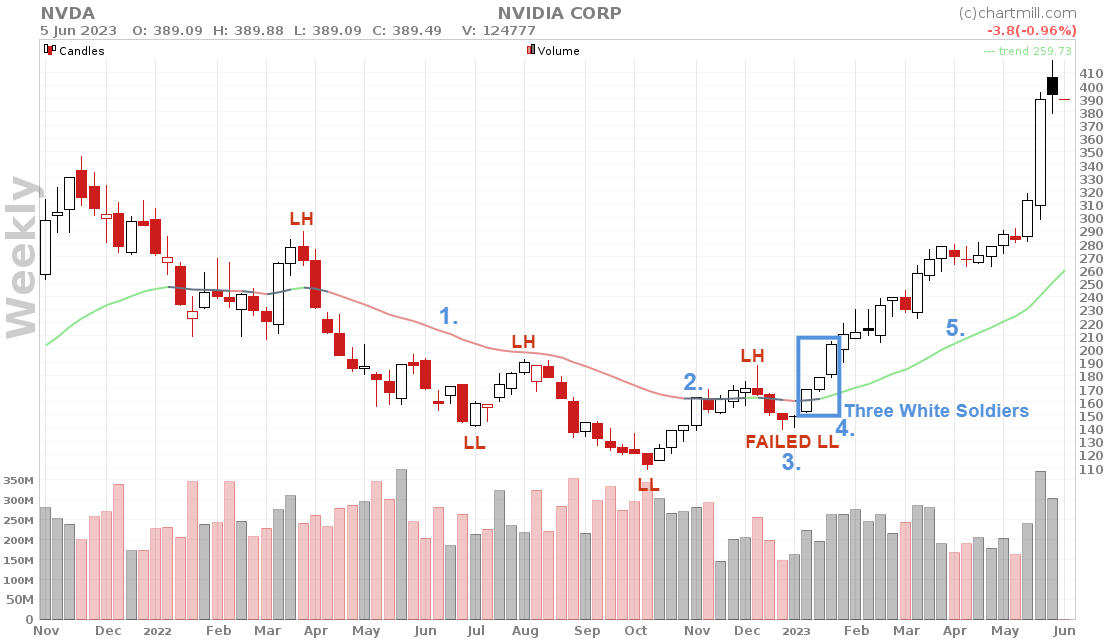
- Long-term trend is down, with consecutive lower highs and lower lows
- Long-term trend becomes neutral
- Swing low above previous swing low (failed lower low)
- Three White Soldiers pattern appears
- Reversal from bearish to bullish trend
Limitations and Risks Associated With Trading This Pattern
It is important to note that relying solely on this pattern to enter trades comes with inherent risks and limitations. While this pattern is a strong bullish reversal signal, it is not foolproof and may occasionally produce false signals.
Market conditions can impact the effectiveness of this pattern. For example, if there is significant resistance at a certain price point or if there are bearish fundamental factors at play in the market, the Three White Soldiers Pattern may not be as reliable as it usually is.
Also, keep in mind that due to the sequence of three bullish candles, the price has already risen sharply. This may create overbought conditions in specific technical indicators such as the stochastics, RSI, or MACD. This can lead to (temporary) selling pressure especially if the price has reached an important resistance level at the same time.
Therefore, traders should consider incorporating fundamental analysis techniques into their trading strategies alongside technical analysis methods like identifying candlestick patterns.
When using any trading strategy based on technical analysis tools like candlestick patterns, it's important to have strict risk management practices in place to minimize potential losses if things do not go according to plan.
The Three White Soldiers pattern has been used for over 400 years by traders in Japan’s rice markets but became popular in Western markets only after Steve Nison introduced it to American traders through his book "Japanese Candlestick Charting Techniques".
Conclusion
This pattern is a bullish reversal pattern that requires close attention when analyzing charts in technical analysis. It consists of three consecutive long-bodied candlesticks that signal a change in trend from bearish to bullish.
The anatomy of each candlestick within the pattern, along with the psychology behind its formation, can provide valuable insights into market sentiment and potential future price movements.
Traders need to understand that while this pattern has a high success rate, it is not foolproof and should not be relied upon solely when entering or exiting trades.
Other factors such as market conditions and volume should also be taken into consideration before making any trading decisions based on this pattern alone. Overall, learning about this pattern and how to identify it can be an excellent tool for traders looking to improve their technical analysis skills and increase their chances of success in the market.
FAQ
What Is The Difference Between the Black Crow Candlestick Pattern and this one?

This pattern is formed by three consecutive long candlesticks with falling prices. Each candlestick opens higher than the previous day's closing price and closes near the low.
The pattern suggests a bearish reversal, indicating that an uptrend could end and a downtrend could begin. The pattern of three black crows indicates strong selling pressure and a shift in market sentiment from bullish to bearish.
