The Bearish Harami Pattern | Trading Strategy and Screening
Bearish Harami Trading Strategy
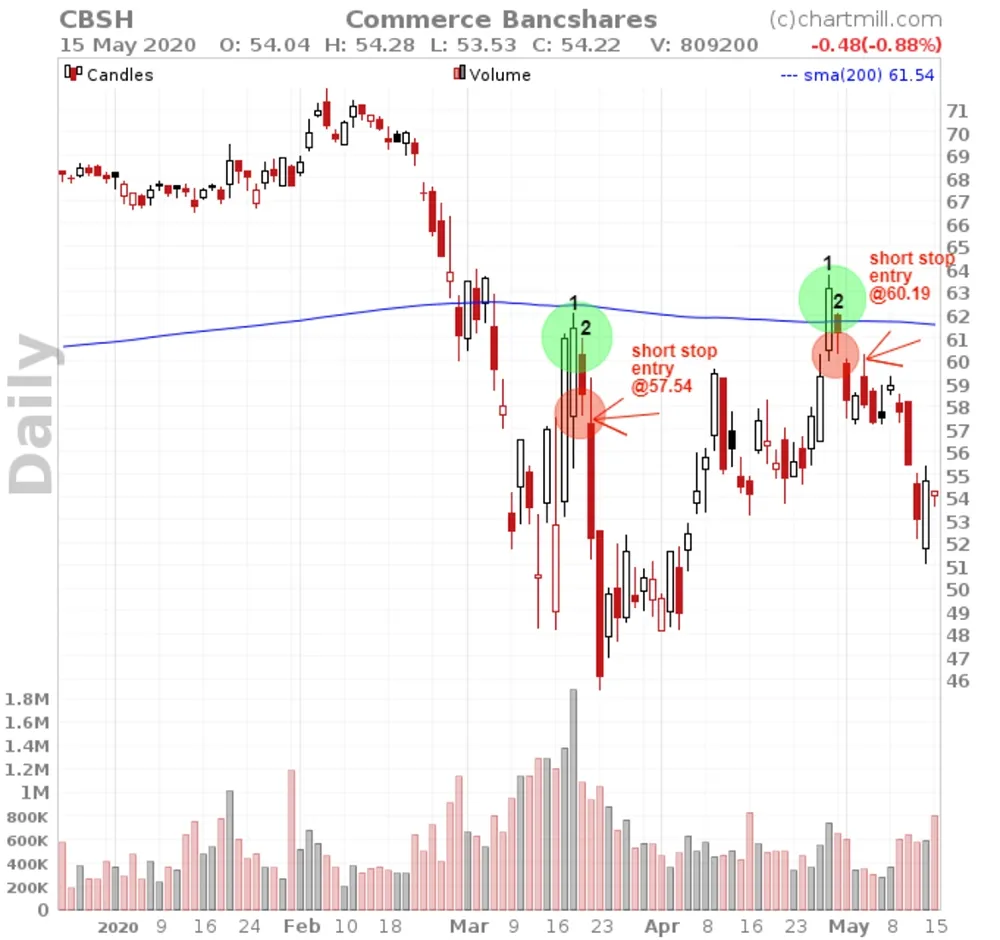
Before entering the trade, it is best to consider the risk/benefit ratio as well. Where do you place the stoploss? Where is the first support and what is your final target? The chart below shows the same bearish harami setups, but i have also drawn an entry and stoploss. A tight stoploss (marked as number 1) or a somewhat wider stoploss just above the high of the harami pattern if you are more defensive (marked as number 2). In both cases, targets of at least 2R with the defensive stoploss and even 3R to 4R for the more aggressive traders were achieved without any problem.
Nice, but could it be any nicer?
Well, if you are more of an intraday trader, the stoplosslevels i’ve mentioned above are still kind of too big. So, let's take a look at the 60m chart after the harami pattern is completed.
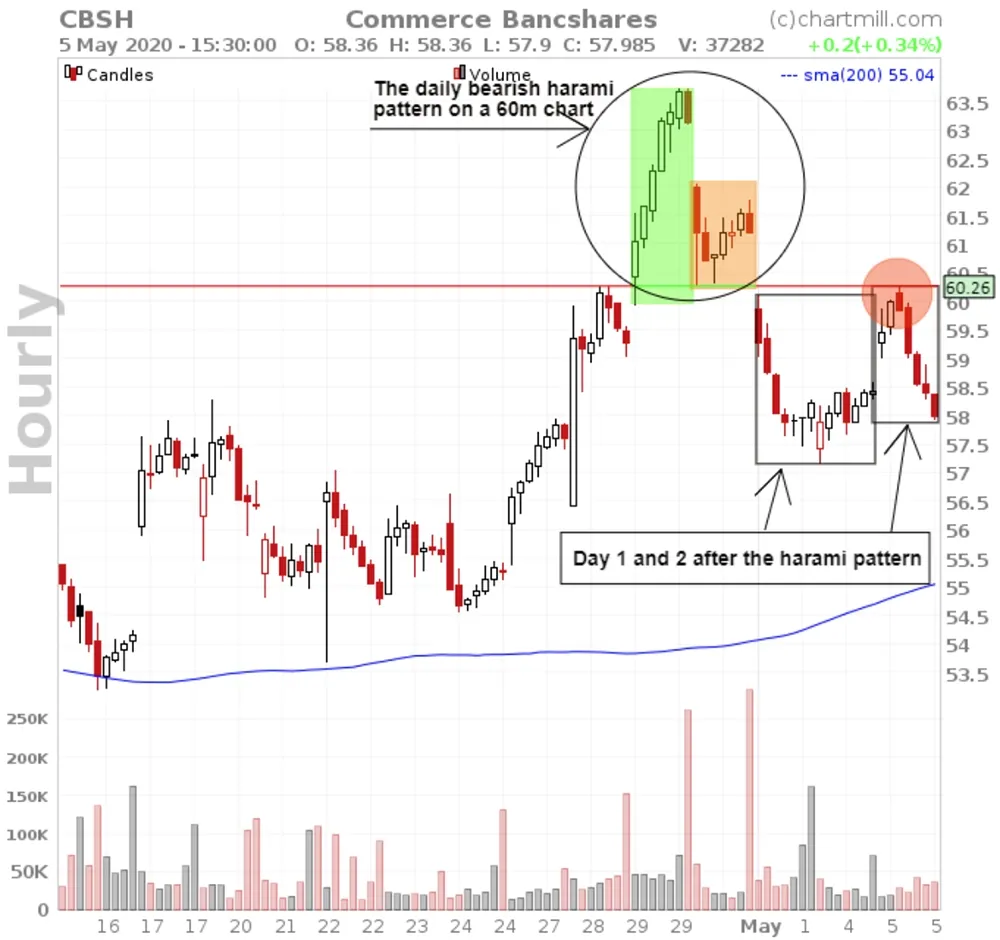
The low of the second day of the bearish harami pattern (the red rectangle) is $60.26. The first day after the pattern we didn’t get a chance to hop on board. Right after the open, price went straight down (4 consecutive red 60m candles, with a low between $57, 5 and $57). The second day price gapped up and retested the low of the pattern in the red rectangle, this was a beautifull trend reversal signal on the 60m chart. A short entry just below $59 with a stoploss above $60.26 was a nice low risk setup...
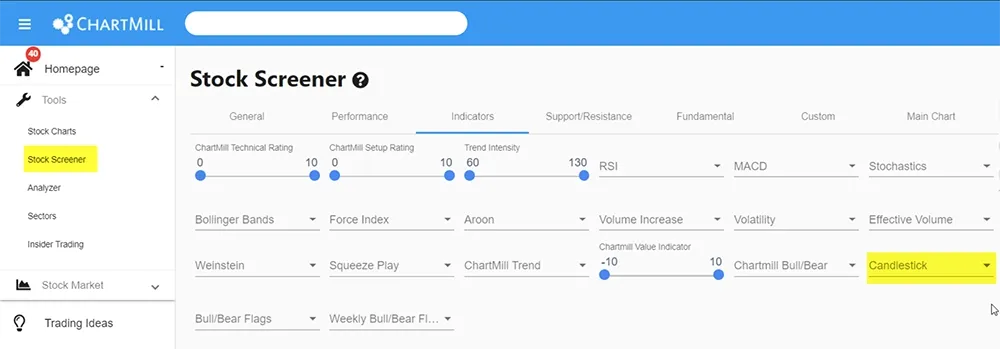
Bearish Harami Pattern Stock Screener
Filtering stocks based on candlestick patterns can be done in the stock screening section under the tab indicators. You'll not only find the harami pattern there, but also numerous other popular candlestick patterns.