Day Trading Stock Screener Settings
Introduction
In this article I want to talk about how to use ChartMill as a daytrader. It is a subject that I have wanted to write an article about for some time because there are some misconceptions. It is often thought that you need at least a stockscreener with real-time quotes to find daytrading setups. Luckily, that's a myth. In this video I explain why and I show a number of screens based on EOD quotes which you can use every day after market close to scan for daytrading setups for the next day.
Be sure to watch the video "Intraday Trading Stock Screener" where I discuss 3 screens that can be used to find intraday setups.
The difference between a stock SCREENING platform and a stock TRADING platform...
First of all I would like to point out the difference between a stockscreening platform (like ChartMill) and a trading platform (Interactive Brokers, Ameritrade, Tradestation, ...).
A stockscreener is used to obtain a selection of stocks that meet your specific requirements on the basis of a number of technical and/or fundamental filters. A trading platform on the other hand is the software that is used to effectively buy or sell shares or other financial products.
A stock screener thus focuses on the analysis that is done beforehand, while the trading platform is the instrument with which the actual trading is done. However, the quality of the preliminary work plays a major role in the success of your trading activities. This first analysis will make sure that during the trading day itself you'll perfectly know which shares deserve your full attention.
Realtime >< End Of Day (EOD)
As a day trader it is obvious that you have real-time quotes available in your trading platform. However, this is not necessary in your screening platform. You can perfectly do the preliminary work based on EOD day charts. You then enter the stocks which result from your first basic selection into your trading platform, so that they can easily be monitored when the daily trading session begins.
Just by means of this first basic selection you'll build in some peace of mind, because you know that you only need to concentrate on those shares. If you have to look for new setups as well as enter orders in already existing setups, in the long run you no longer know what you're doing and the chance that you make (expensive) mistakes increases...
Basic Daytrading Filters in ChartMill
A Few Basic Principles
Some general rules are important when looking for possible day trading setups:
- Avoid stocks with insufficient liquidity. Too low volume makes it harder to buy or sell stocks at the desired price, and that's crucial in day trading.
- Look for stocks with plenty of volatility. This means that the price of the shares must move up and down sufficiently. After all, it is this movement that is needed to make a profit. Which direction is not important, as long as it moves!
- Avoid penny stocks. Not everyone will agree with this rule, but with this point I mainly address the less experienced traders. After all, it's precisely the penny stocks that are most likely to have insufficient volume. The sometimes extremely low prices ensure that these shares can easily be manipulated by a few larger buyers/sellers. Not something you want to get involved in as a trader. Therefore, always use a minimum price when choosing stocks.
Default Filters
With the above general rules in mind, I am now going to set up some simple basic filters in ChartMill
Market | minimum price | minimum volume
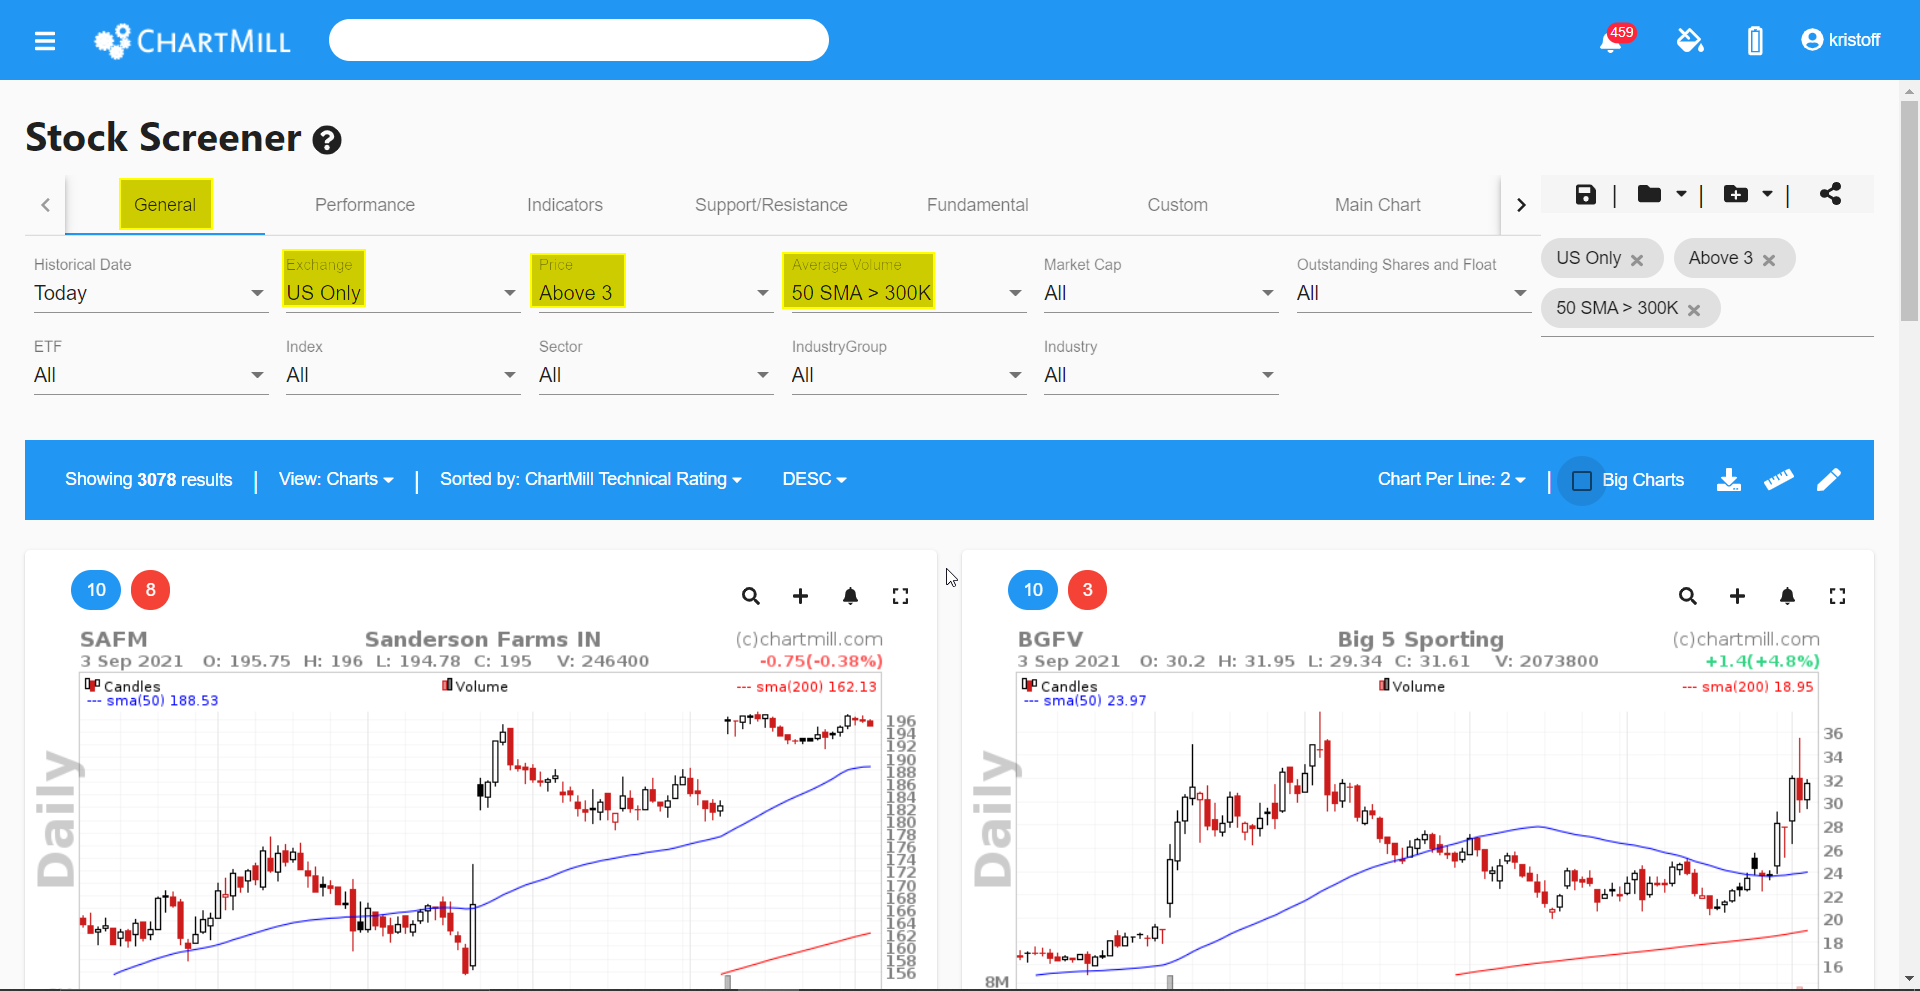
In this example, I only want to withhold US stocks with a minimum price of 3$ and a minimum average volume greater than 300,000 measured over the last 50 trading days.
No ETF"s / All ETF's
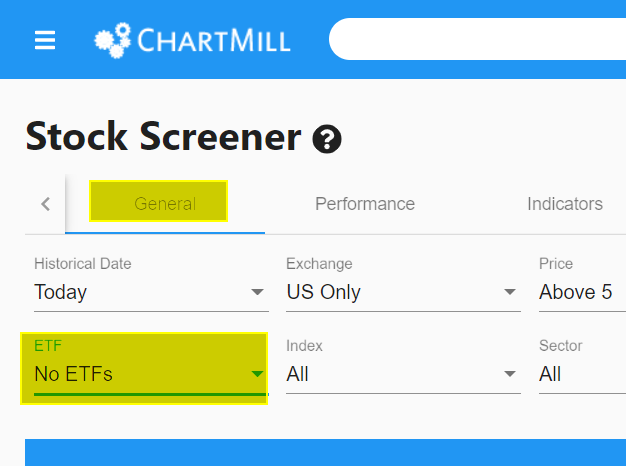
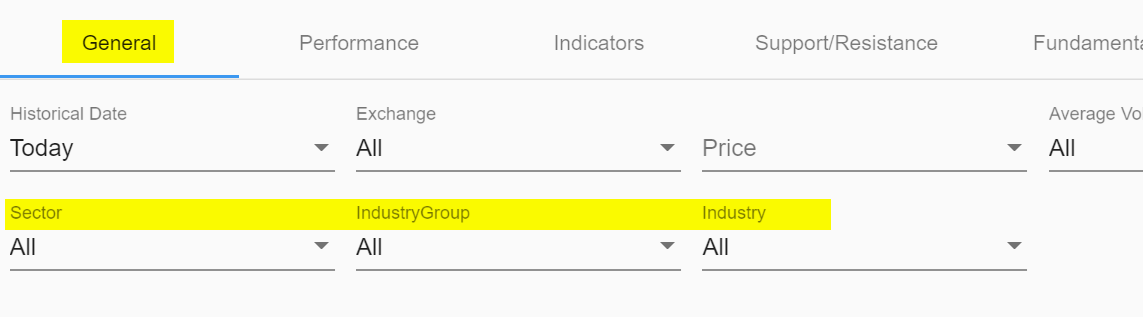
If you only want to withhold stocks, you can choose to exclude all ETFs from the results. You simply do that by selecting the "No ETFs" option under the "General" tab.
Direct Link Basic Filter No ETF's
If you want to further select a specific index, Industry or Sector you can configure that as well under the 'General' tab.
Optional Daytrading Filters in ChartMill
In addition to these broad basic filters, there are also quite a few optional filters available that are of interest to daytraders.
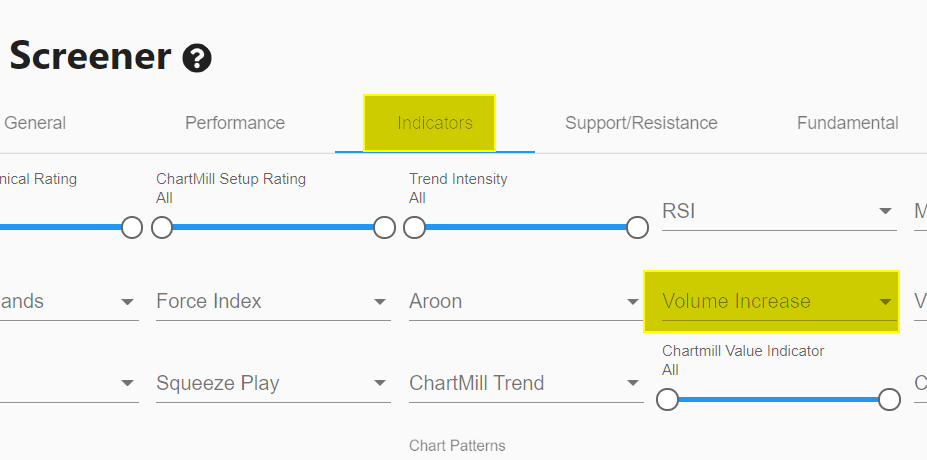
Volume increase
Rising volume means that the stock is more sought after and therefore it is often a good indication of an upcoming price movement. Especially when the volume rises before the price does, it is really worthwhile to follow the share very closely and add it to your watchlist. In ChartMill, you can set up such a volume filter via the 'Indicators' tab under the option 'Volume Increase'. There are quite a few options available. The simplest but perhaps best way to start is the 'Volume More Then Previous Volume' option.
Direct Link Volume Filter (Volume 10% More Than Previous Volume)
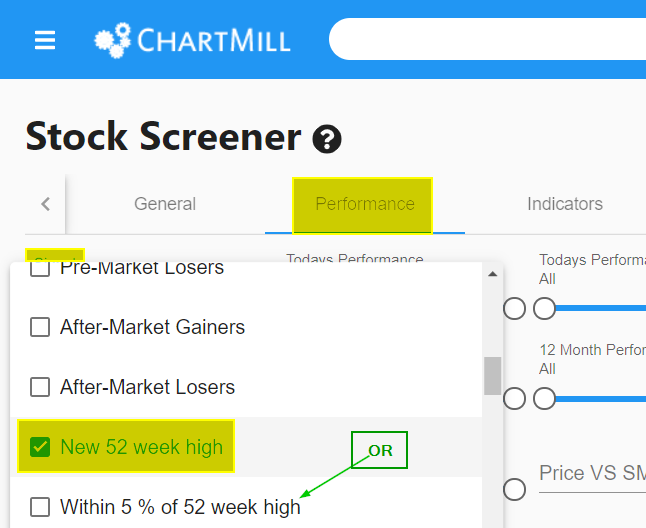
Stocks that have reached their highest annual price or whose price is within 5% of that highest price.
Stocks that are about to overcome an important price level are by definition interesting for those looking for volatility. For stocks that quote just below their highest annual price, the price level acts as a magnet while stocks that have just overcome their previous highest annual price are in the sights of breakout traders. As a result, the price may get an extra boost. This is exactly the potential that these filters offer. Under the 'Performance' tab, select 'Signal'. From the drop down menu you then select 'New 52 Week High' or 'Within 5% of 52 Week High'.
Keep in mind that you cannot select both at the same time (otherwise you will get zero results).
Direct Link Price Filter (Within 5% of 52 week High)
Specific Candlestick Patterns
Candlestick patterns such as the Bullish or Bearish Engulfing pattern, a Bullish Hammer or a Bearish Hanging Man or an Inside Bar pattern are known to be indicative of larger price movements. Thus, if the price closes with a specific pattern at the end of the trading day, this is valuable information for the day trader looking for stocks that are about to make a significant move at the start of the next trading day.
In ChartMill you can filter based on these candlestick patterns, in the stock screener select the 'Indicators' tab and then choose the 'Candlesticks' drop down menu.
Direct Link Candlestick Filter (Bullish Engulfing)
2% GAP UP Stocks with Closing Price near the High of Day
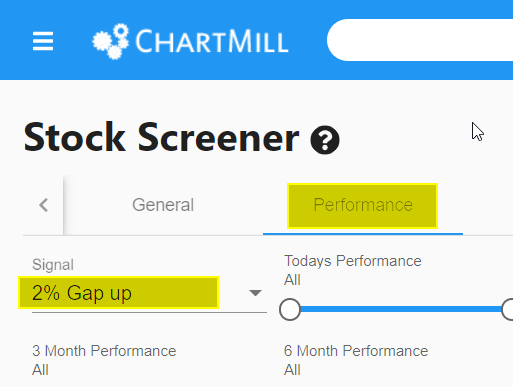
Stocks that suddenly show a gap up and also close near their highest daily price are ideal candidates for momentum plays. In this screen I have used a custom filter.
The first parameter is simple, select the signal '2% GAP UP' under the performance tab on the stock screener page.
A GAP is only successful if the price does not collapse again after the initial gap! The most ideal scenario is a candle which, after the gap, closes near its highest day price.
You'll have to define such a unique filter yourself in Chartmill. You can do so via the 'custom tab'.
First, select the 'Custom' tab on the stock screener page.
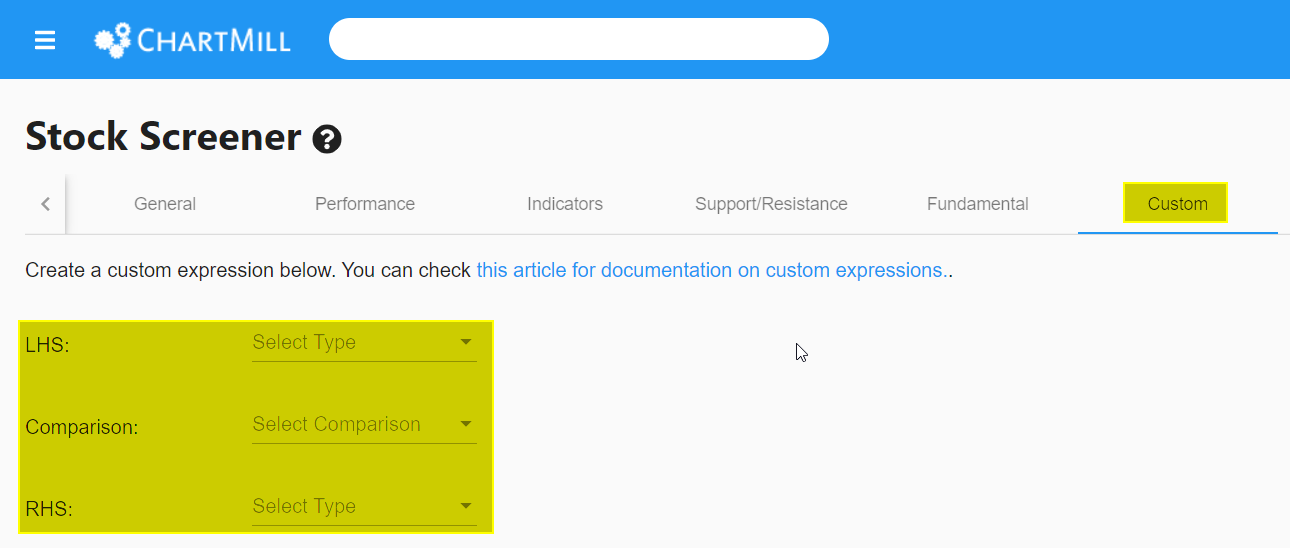
In this screen, I am now going to create the filter.
- LHS stands for Left Hand Side of the Comparison.
- RHS stands for 'Right Hand Side of the Comparison'.
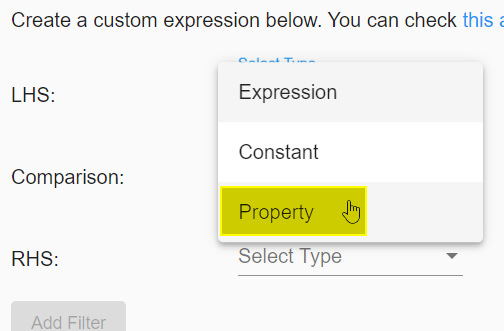
Click on the inverted triangle next to 'LHS'. Next, choose 'Property'.
Your screen should now look like this:
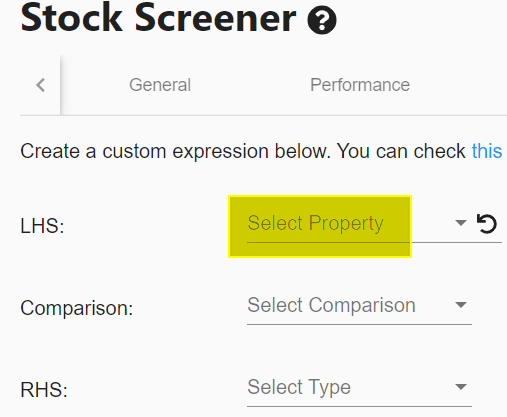
Click again on the inverted triangle in the same ticker field (again next to LHS) and now choose the property 'Current Price' from the drop down menu.
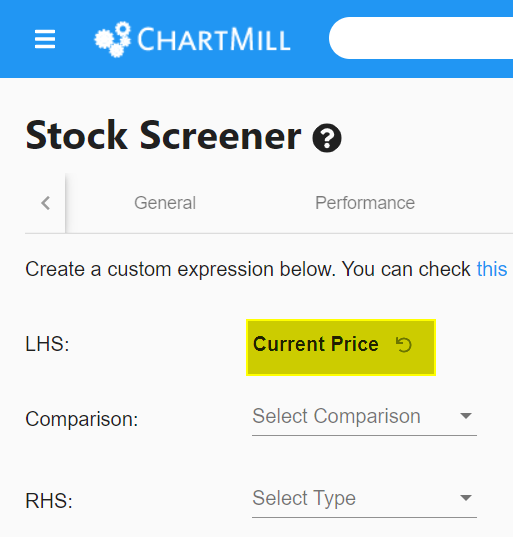
Now click on the inverted triangle next to 'Comparison' and select " higher than".
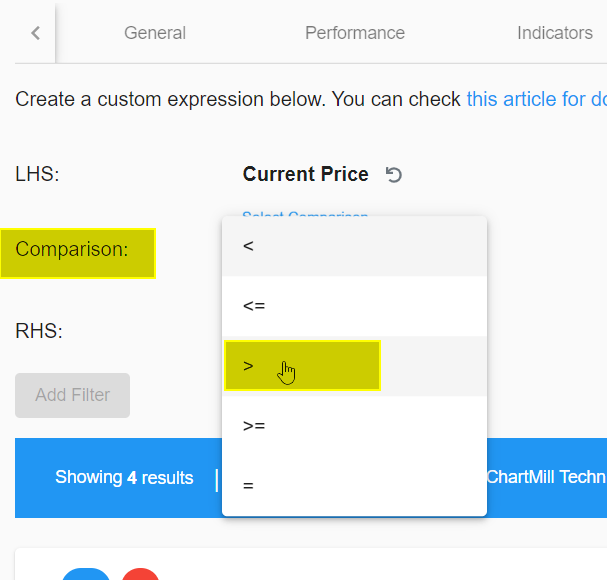
We have now determined that the current price must be higher than.... We define the rest of the equation using the 'RHS'. Next to 'RHS' select 'Expression'...
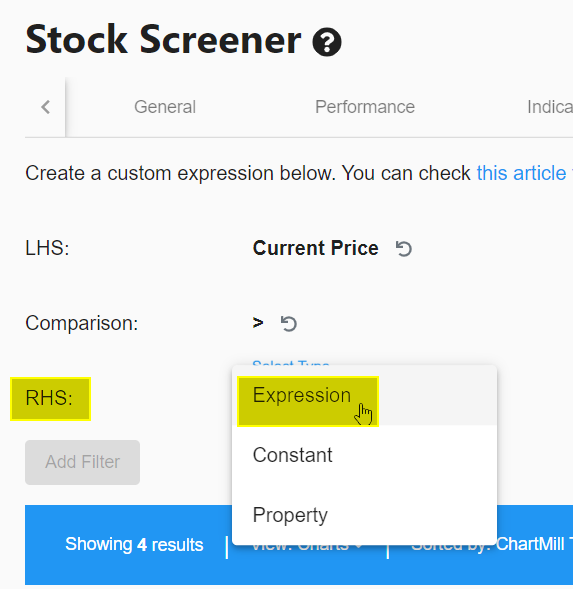
A new submenu will open and you will see the following screen.
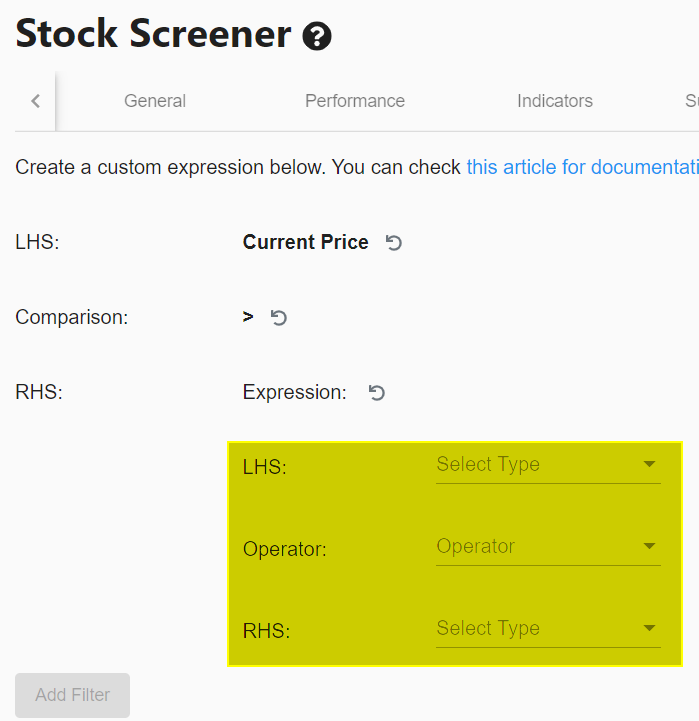
Enter the following values :
- LHS > Property > High Price
- Operator > * (multiply)
- RHS > Constant > 0.99
Your screen should now look like this:
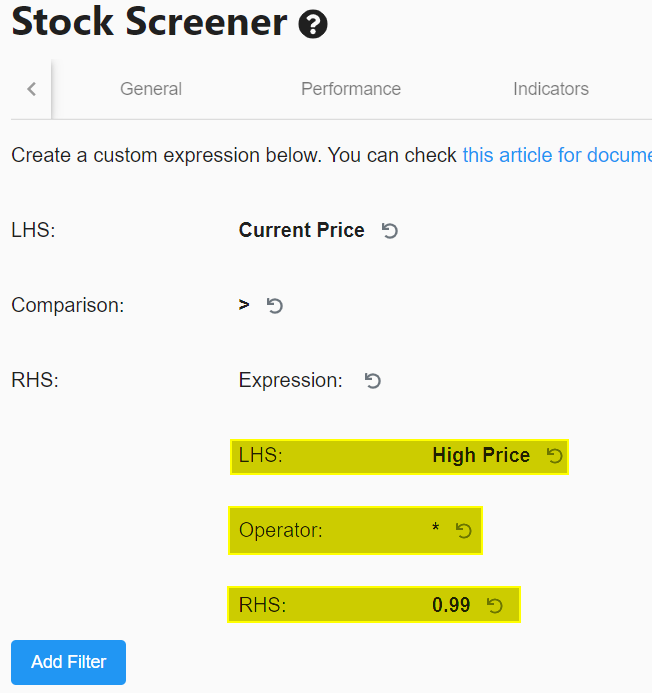
Next, press "Add Filter”
Congratulations, You have just created a custom filter which ensures that the current closing price is higher than the highest price that day - 1% (hence the * 0.99). Or in other words, the closing price can only be 1% lower than the highest price of the same day. This ensures that we have not only selected stocks that are gapping up at least 2%, but whose closing price must simultaneously be close to the HOD.
Direct Link to Filter (Gap Up and Custom Filter)
Pre Market Movers
Perhaps one of the most popular filters for Daytraders are the premarket movers - see this article and this video. There are several ways to view this filter. But since we have done everything from the stock screener so far we will do the same for this filter. Choose the signal "pre-market gainers" in the Performance tab of the Stock Screener.
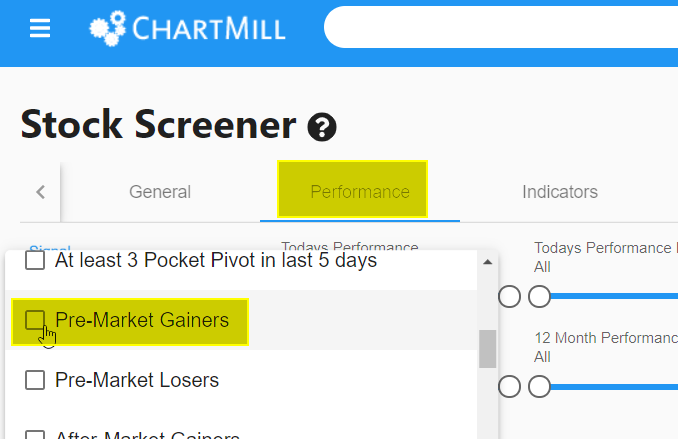
This will show you all stocks that have risen at least 2% in the pre-market. If you want to look for all stocks that fell by at least 2% in the pre-market, select the option 'Pre-Market Losers'.
Please note that this filter only works during the pre-market session.
Direct Link to Filter (Pre-Market Gainers)
Combining different filters for best results
The real power of a good stock screener is revealed when different elements of separate screens are combined into one superscreen.
Below I show an example of such a filter based on the filters used above on date of September 03, 2021 where only one candidate remains in the end.
This is purely for illustration purposes to show what is possible if you keep refining the filters. In daily use it is certainly not necessary (and even counterproductive) to go that far. A few good basic filters will almost always provide a decent selection from which you can choose a number of stocks that catch your eye and which you can continue to analyze manually on the Stock Charts page.
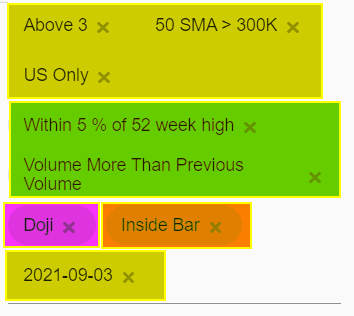
Yellow: basic filters > 3071 shares Green: additional signal filters > 225 shares left Orange: candlestick pattern 1 > 18 shares left Purple: candlestick pattern 2 > 1 more shares
Direct Link to Filter (set to September 03, 2021 to obtain the same result as shown here).
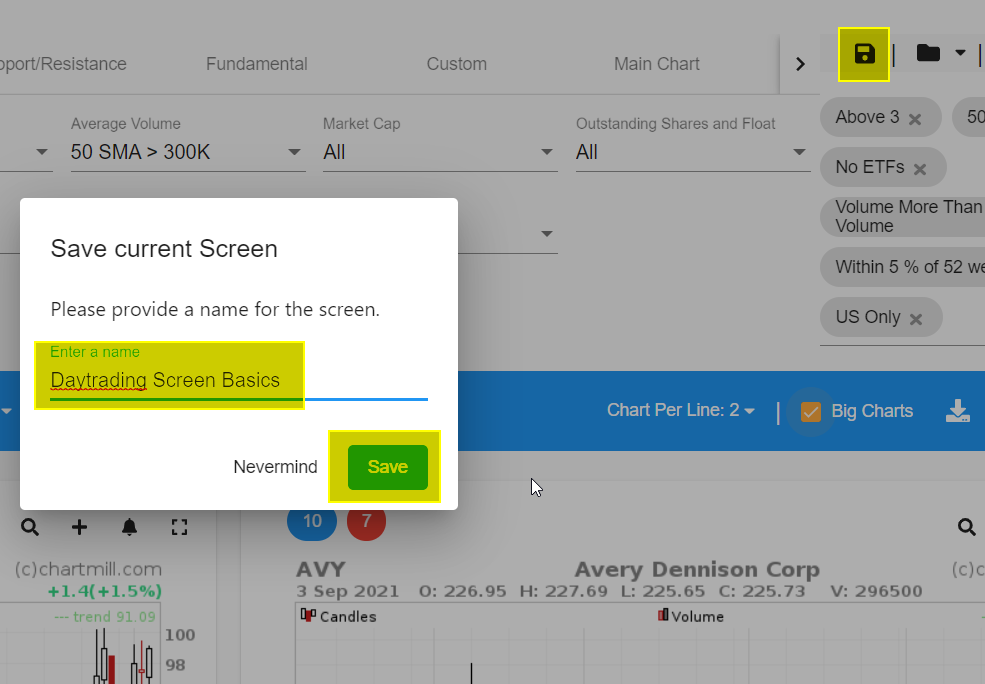
Saving Your Screens
Once you've set up a selection of filters, save them as a screen filter so you can easily recall it later. To do this, click on the folder icon in the top right corner of the screen. Add a name and click on the 'SAVE' button.
To test the filter, open a new empty stockscreener page. Click on the map icon in the upper right corner of your screen.
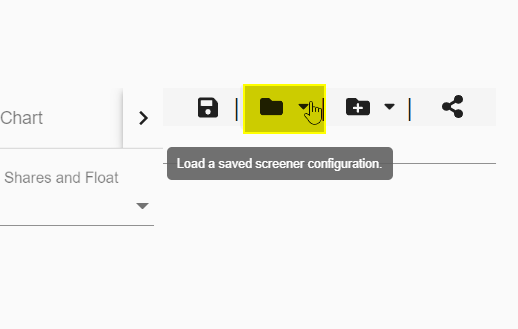
Now choose from the drop down menu the screen you just created.
ChartMill will now show you the results of that screen, even if you're going to request it tomorrow or next week.
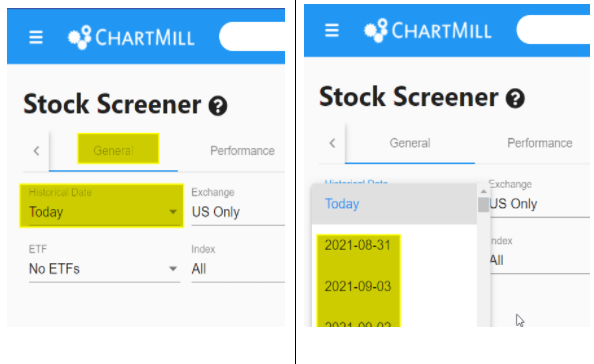
By the way, did you know that you can also use the screen to check which shares were generated on any date in the past. Once your filter is active, go to the 'General Tab' and select 'Historical Date'. Next choose a date from the dropdown menu. This option is useful if you want to find out what outcome some filters had in the past and how that compares to the performance of those stocks now.
A FEW MORE TIPS
- It can be useful to save different versions of basic screens separately. That way you can quickly switch between filters that have 90% of the same settings but differ in only one component. Consider this filter (created on 03/09/2021 with 186 results) and then its results separately for the Russel 2000 (48 stocks), Nasdaq 100(9), S&P500 (51) and the Dow Composite (3).
- Keep in mind that the more filters you add or the more detailed you define a specific (custom) filter the smaller the number of results. So always start with a first broad selection and then add filters if you think the final selection can be improved.
- Another place where you'll undoubtedly find a lot of inspiration to find decent basic screens for intraday setups is our Trading Ideas page. More info in this video. These are screens made by ChartMill itself or users of ChartMill. You can use them as a starting point for fine-tuning your own personal filters!
- By the way, did you know that the successive results of your screens can reveal price trends... How exactly does that happen? For example, let's say you have a screen for which one of the filters specifies that the price should be within 5% of the highest annual price. Let's take this filter as the base screen (03/09/2021). Applied to the current bull market we are in today, this gives quite a lot of results (152 shares). However, look at the same filter on 25/02/2020, when markets worldwide were at the beginning of a solid decline. Using the same filter, we then ended up with only 81 shares. And what is particularly interesting are the following days. On 26/02/2020, barely 1 day later, the number of shares meeting the screen had already been reduced to 34. On 27/03/2020, there were only 19. On 18/03/2020, there were only 3 shares that met the same screen! So if you suddenly notice that your bullish screen filter is giving less results day after day, this could be a warning sign that the current market trend is losing momentum and it might not be a bad idea to become a bit more cautious.
Once you get used to working with your own screenfilters you won't be able to do without them anymore! You'll save an enormous amount of time and you won't have to worry about finding decent (day)trading setups for the upcoming trading day.