Fundamental Health filters
By Kristoff De Turck - reviewed by Aldwin Keppens
Last update: Mar 8, 2024
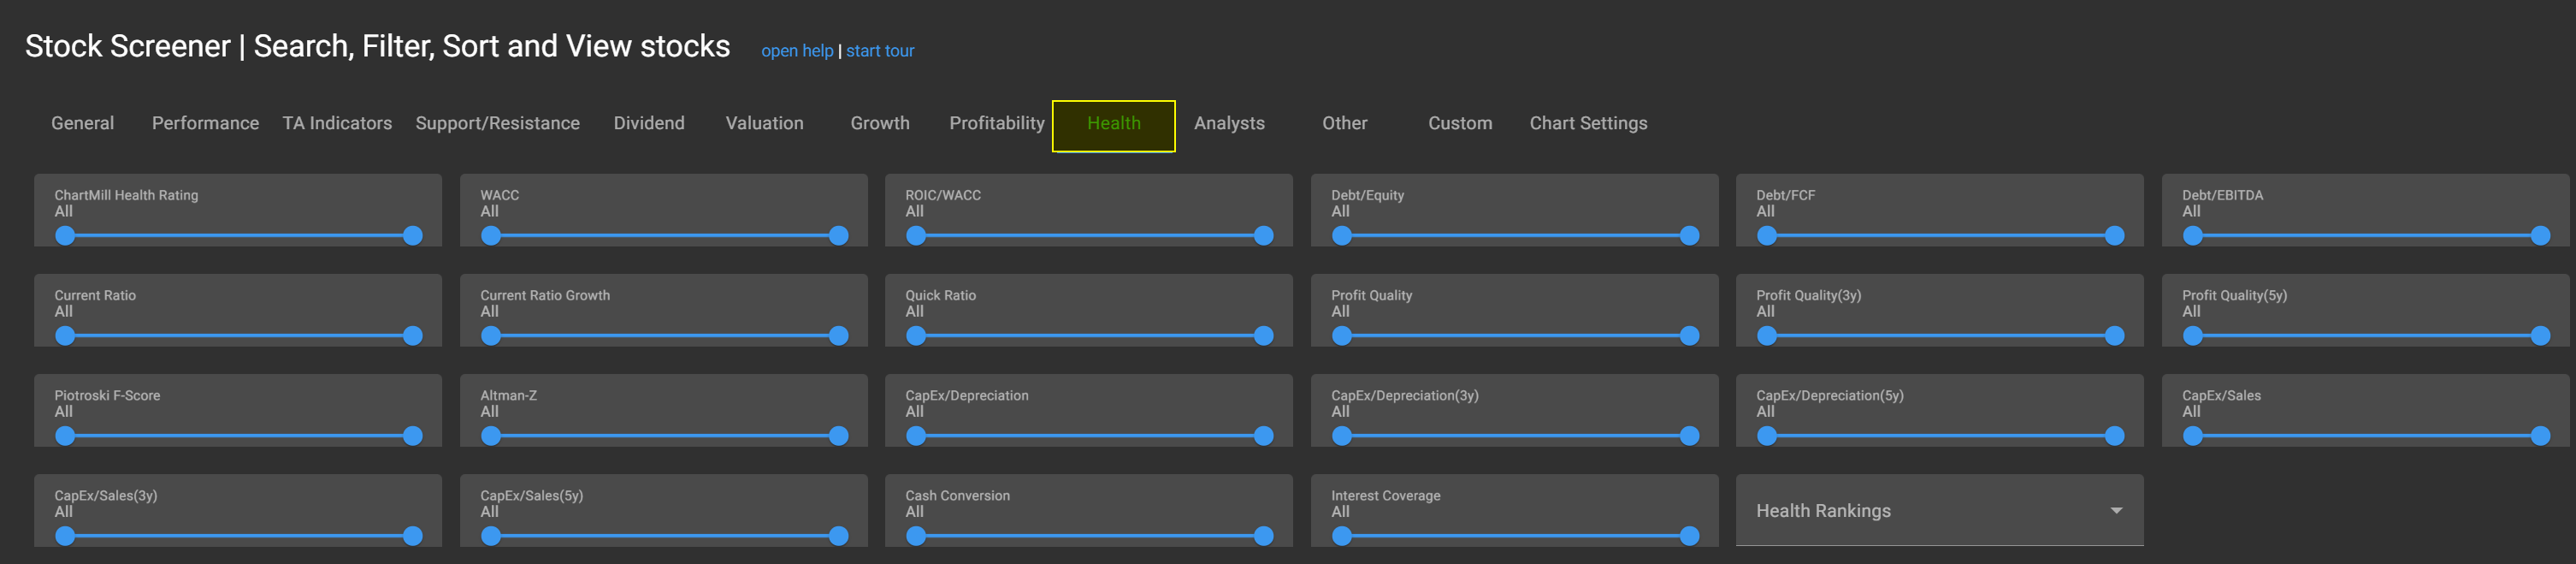
In this article we will discuss the available fundamental filters related to the Finanical Health of a stock. All these filters are available in our stock screener and can be found on the Health tab.
Current Ratio
The Current Ratio is used to determine to what extent an enterprise is able to settle its debts in the short term (the so-called liquidity of an enterprise). 'Short-term' refers to debts paid during the current financial year.
The ratio reflects the ratio between current assets (liquid assets included) + cash assets (all assets of a company which are generally less than 1 year of service to the company) and short-term debt. Current assets include: inventories (both raw materials and finished products), outstanding receivables, securities (shares, etc.).
Examples of short-term debt are the supplier credit, debts on current account and tax debt. The higher the outcome, the better the liquidity position of the company. A number lower than 1 indicates that there is more short-term debt than current assets. This means that it will be difficult or even impossible for the company in question to pay short-term debts. The question 'what is an acceptable current ratio' is difficult to answer because this figure is very sector-bound. A ratio of 2 is more or less widely accepted as a safe liquidity position.
However, some nuance is in place. A number (much) higher than 2 actually says that the company has too many current assets. Please note that the stock of a company is included as current assets, which could have a significant impact on the calculation of the current ratio. And keep in mind that those goods have not yet been sold.
A large stock can be normal for a company, but if this is the result of a (strong) falling demand, there may be a (big) problem... The 'Current Ratio Growth' compares the current ratio with the ratio of the previous financial year to get an idea of how the liquidity ratio in a company evolves.
Quick Ratio
The Quick Ratio provides an answer to the problem we outlined above with excessive inventory. After all, the formula of this ratio is equal to the current ratio with one major difference. Inventory is not taken into account. Only assets that can be converted quickly into cash are taken into account.
What ratio you use will depend mainly on the type of company you are investigating.
- For a company that supplies its products almost immediately to the customer, the current ratio can be used. In this case, the stock is quickly converted into cash.
- For companies that have a large stock of raw materials to make and sell their finished products, this is a lot more difficult. That stock can not be converted to cash so quickly, so it's better to use the quick ratio.
By using these two ratios, you can also determine the extent to which the inventory of an enterprise plays an important role in the company's current assets. A current ratio> 2 but a quick ratio <1 is a clear indication that the stocks of the company make a significant contribution to the company's liquidity.
Debt/Equity
Debt/Equity is used to determine the level of debt of a company. The total debt is compared with equity to understand the extent to which debt is used as a leverage to finance a company. A ratio higher than 1 means that more debt is used than equity while the opposite applies if <1.
The higher the figure the more debt and thus the more risk for the company. The lower the figure, the more equity used and the lower the risk. In any case, it is important that when using more lending than equity, the resulting net profit is greater than the interest payable due to the debts.
And remember, capital-intensive companies (for example, in the automotive industry) will usually have more need for foreign capital and, consequently, have a higher debt/equity ratio than companies in other sectors/industries. Be sure to take this into account when using this ratio.
Read more detailed information about theDebt/Equity ratio.
Debt/Free Cash Flow (FCF)
The Debt/Free Cash Flow ratio offers valuable insights into a company's ability to manage its debt obligations in relation to its free cash flow, providing investors with a nuanced perspective on financial strength and sustainability.
Read more detailed information about theDebt/Free Cash Flow ratio.
Cash Conversion
The Cash Conversion Ratio is a financial management tool that provides insights into how efficiently a company is converting its accounting profit into actual cash flow.
A Cash Conversion Ratio greater than 1 indicates that the company is generating more cash flow than its net profit. This suggests efficient cash management and the ability to convert a significant portion of its accounting profit into actual cash. On the other hand, a ratio less than 1 may imply that the company is converting a lower proportion of its net profit into cash.
Read more detailed information about the Cash Conversion ratio.
Interest Coverage
The interest coverage ratio, often referred to as the "debt-service ratio" or "times interest earned", is a crucial metric that sheds light on a company's ability to meet its interest obligations.
Calculating the Cash Conversion Ratio is done by by dividing a company's 'Earnings Before Interest and Taxes' by its 'Interest Expense'.
Read more detailed information about Interest Coverage ratio.
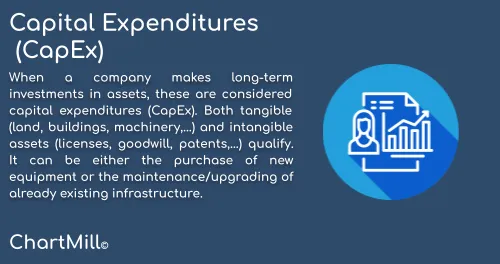
Capital Expenditures
When a company makes long-term investments in assets, these are considered Capital Expenditures. Both tangible (land, buildings, machinery,...) and intangible assets (licenses, goodwill, patents,...) qualify. It can be either the purchase of new equipment or the maintenance/upgrading of already existing infrastructure.
This type of financial expenditure is made by companies to increase the scale of their existing operations or to invest in new technologies that can then add a future economic benefit to the operation.
Read more detailed information about Captial Expenditures.
Related Articles
Fundamental Growth Filters
In this article we will discuss all the available fundamental filters related to the Growth of a stock. Read more...
Fundamental Valuation Filters
In this article we will discuss all the available fundamental filters related to the Valuation of a stock. Read more...
Fundamental Profitability Filters
In this article we will discuss all the available fundamental filters related to the Profitability of a stock. Read more...
Fundamental Dividend Filters
In this article we will discuss all the available fundamental filters related to the Dividend of a stock. Read more...