
Creating Custom Expressions in the screener
INTRO
In this article I'll take a look at the custom expressions component. This is a very powerful functionality that sets ChartMIll apart from many other stock screeners. It allows you to create your own individualized screening filters with all the available screening properties in ChartMill.
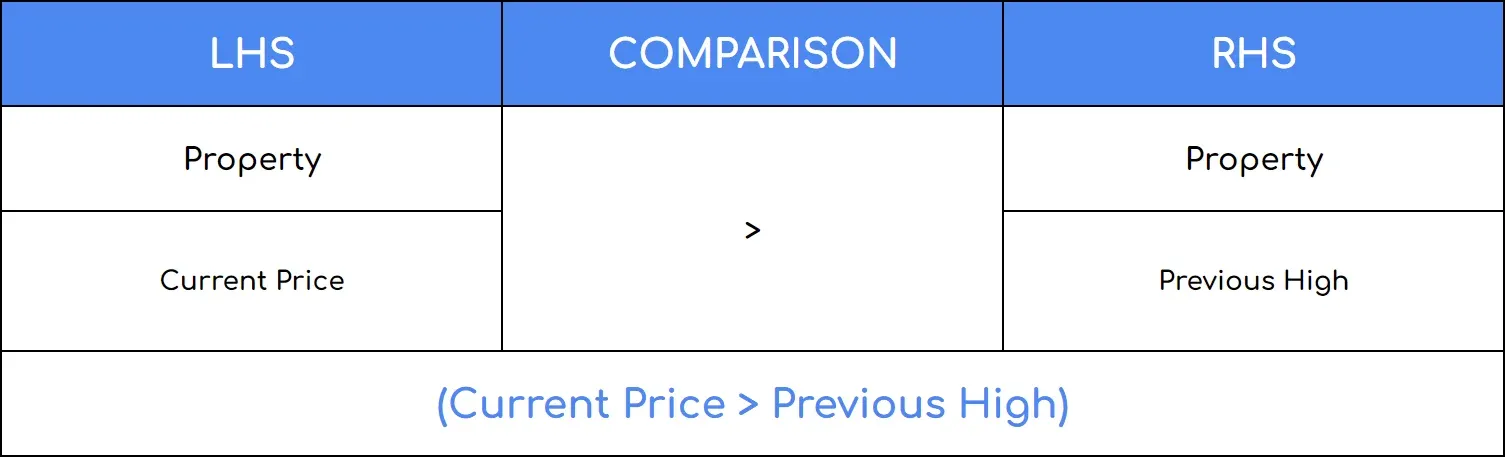
Combining different properties into a personalized filter is called an 'expression' and a complete expression always has the following three parts:
- LHS: left hand side of the expression
- Comparison: the comparison function
- RHS: right hand side of the expression
So if we want to define that A > B, 'A' is defined in the LHS, the comparison function '>' comes in the equation and 'B' is finally defined in the RHS.
For both the LHS and RHS, there are three options:
- An expression: an expression with a mathematical operator (such as +, -, *, /) which again creates two sides
- A constant: for example, 5 or 34 or 0.45...etc.
- A property: one of the properties described in the documentation
This may seem a bit complicated at first but from the examples below you will quickly see that it really is all quite straightforward.
EXAMPLES
Example 1: price versus 52w high
In the standard screening filters, there are several options available that allow you to define the price versus the '52-week high'
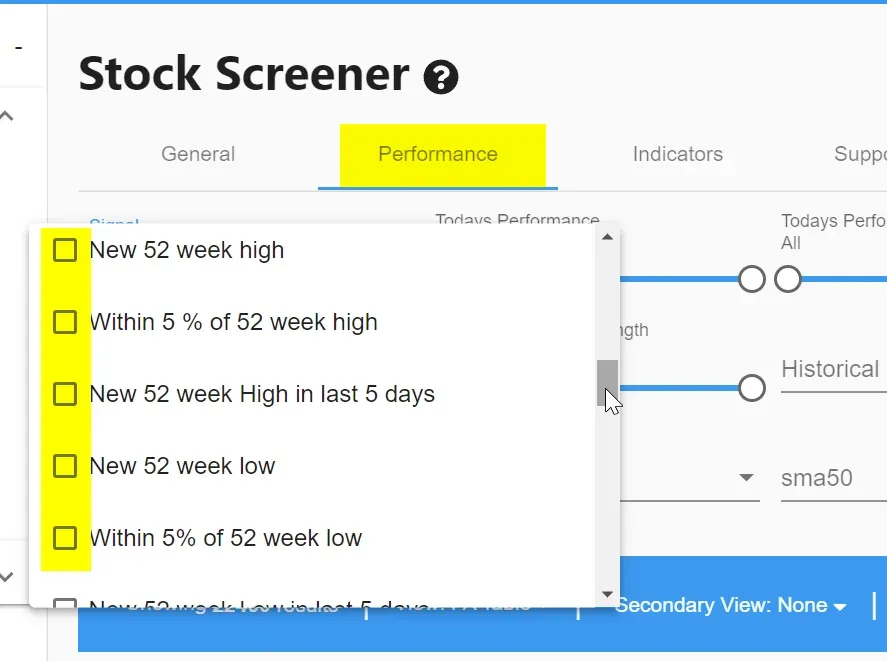
However, the options are limited because it would become far too cluttered to display all percentages as default filters. In the stock screener, for example, there is the possibility to filter stocks that are maximum 5% away from the '52-week high'. If you consider this distance too small and you would rather change the 5% into a margin of 10%, you will have to use a custom expression. And this is how you do it:
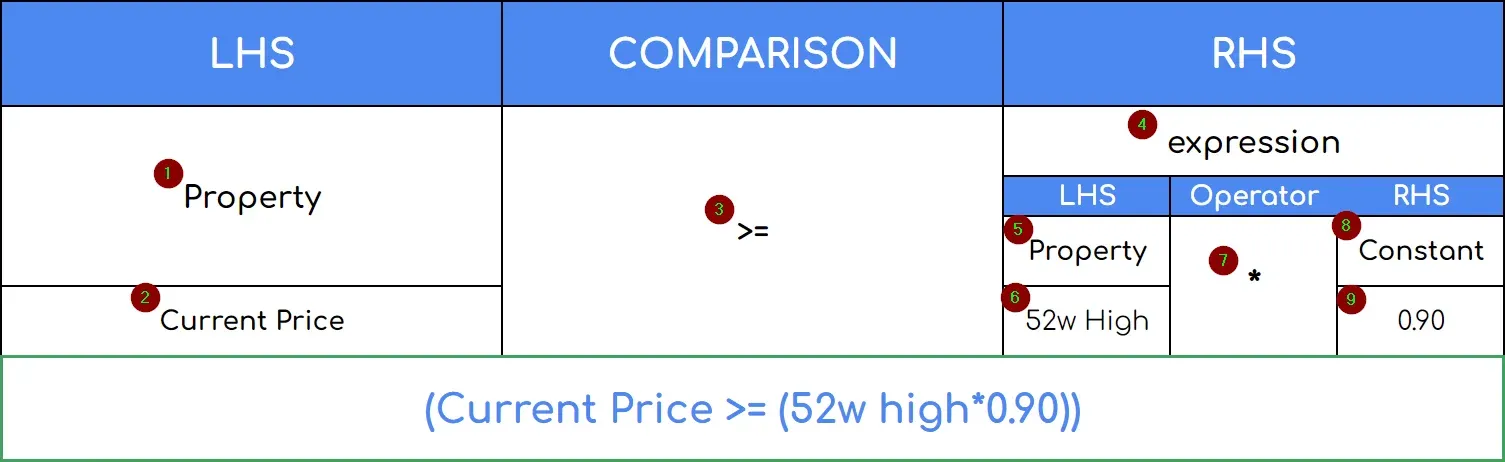
- For the LHS select ‘Property’ (1), than select ‘Current Price’ (2).
- For the Comparison select ‘>=’ (3)
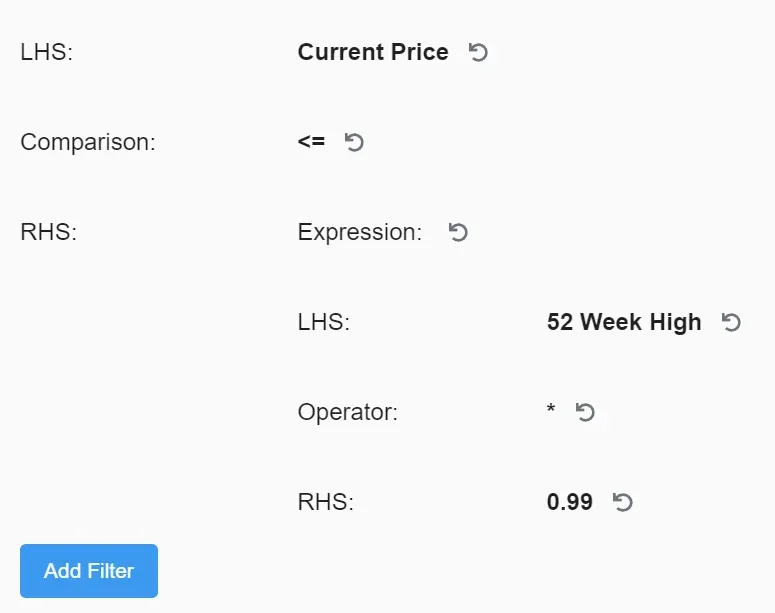
- For the RHS select ‘Expression’ (4), than for the LHS select ‘Property’ (5) and choose ‘52w High’ (6). For the Operator, select ''* (7) and for the RHS select ‘Constant’ (8) and fill in '0.90' (9).
In the screener, it looks like this:
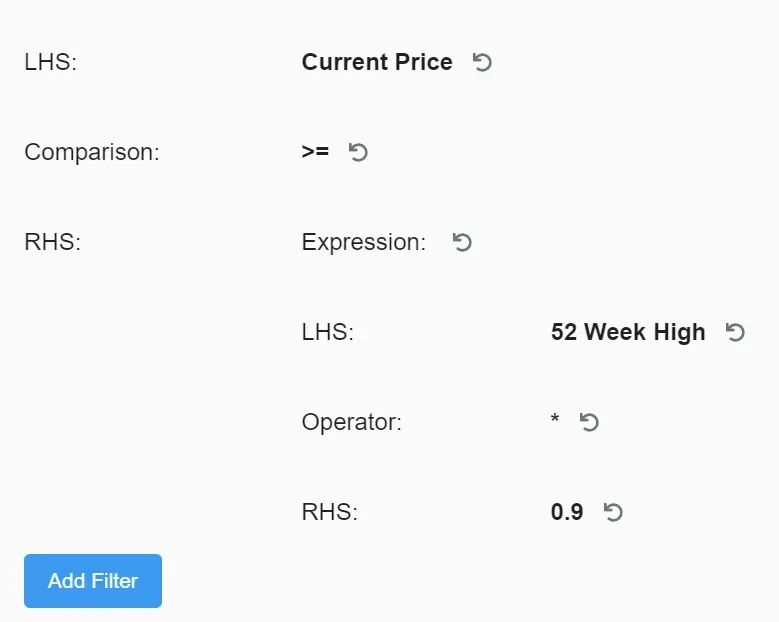
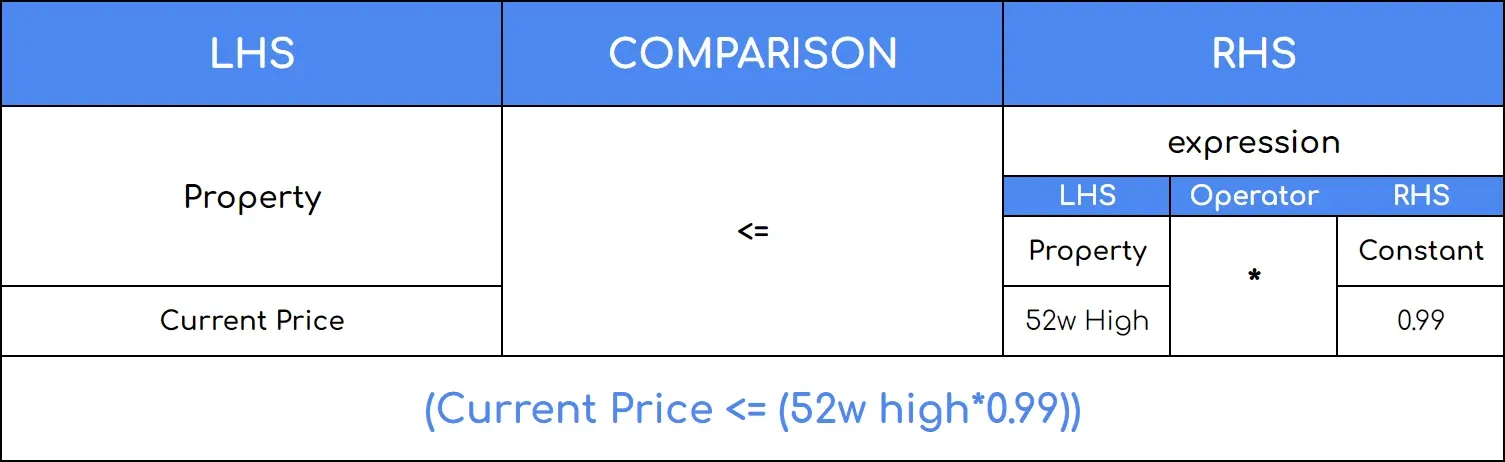
We use the constant '0.90' to multiply by the '52-week high' to arrive at a value that is 10% lower than that highest 52-week price. Suppose the '52-week high' is at 100. By multiplying by 0.90 we obtain the value 90 (which is exactly 10% lower than 100). Now only those stocks that are at most 10% away from their '52-week high' are retained, but of course this also includes the stocks whose closing price itself represents the '52-week high'. If we want the price to be at least 1% below the '52-week high', we again use a custom expression with the following properties:
The screener is showing this:
By combining two custom expressions, we have defined that we only want those stocks that are at most 10% away from the '52-week high' but at the same time are still at least 1% below that same '52-week high'.
Example 2: Defining Candlestick Patterns
The added value of using custom expressions are particularly noticeable when you want to define patterns that include both today's and yesterday's price. An example of this is found in the Bollinger bands strategy.
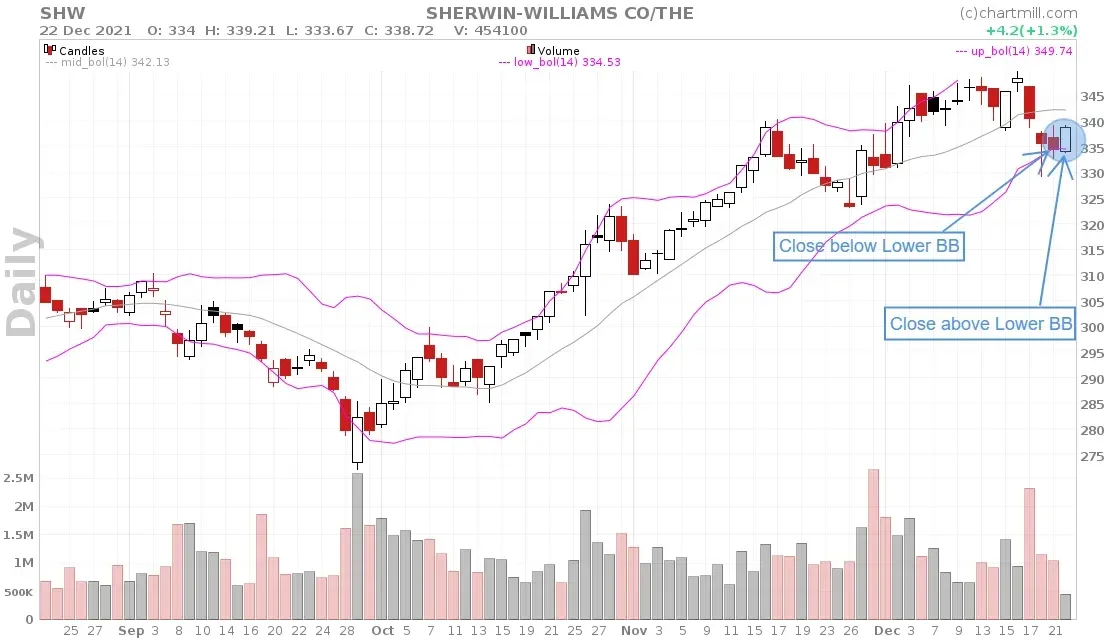
For this strategy we are searching for a reversal pattern based on the price movement for the last two days as shown in the chart above. The stock shows a rising trend and the second last trading day the price closed below the lower bollinger band. However, the current close is again above the lower bollinger bands.
Defining that previous trading day is not possible with a standard built-in filter. To do so, we need to use a custom expression.
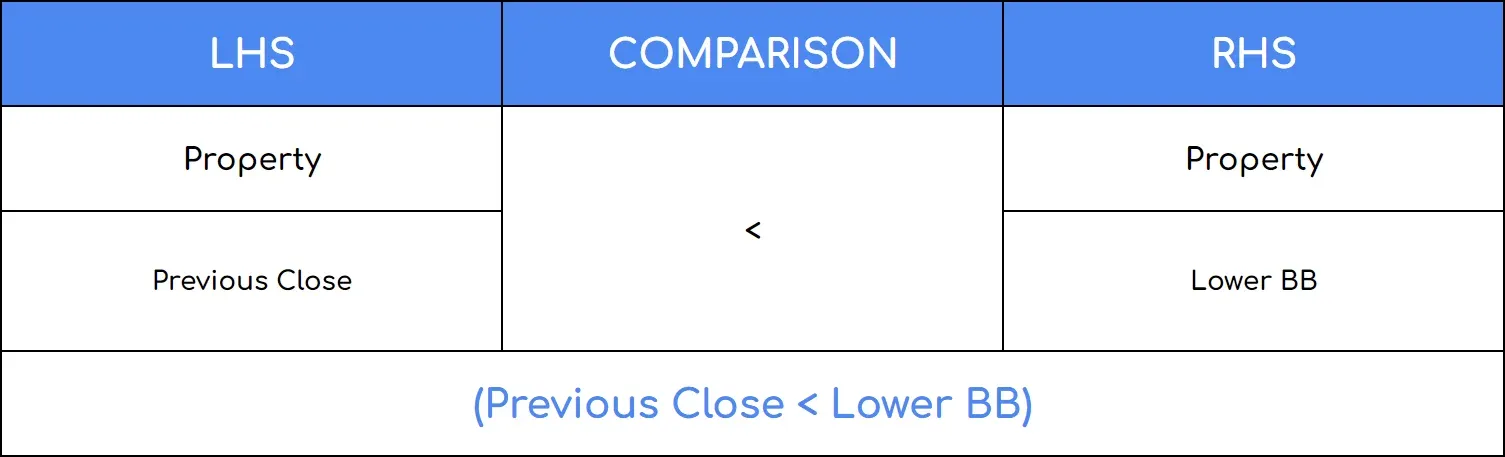
- Condition to be defined: the previous trading day's close must be below the value of the lower bollinger band.
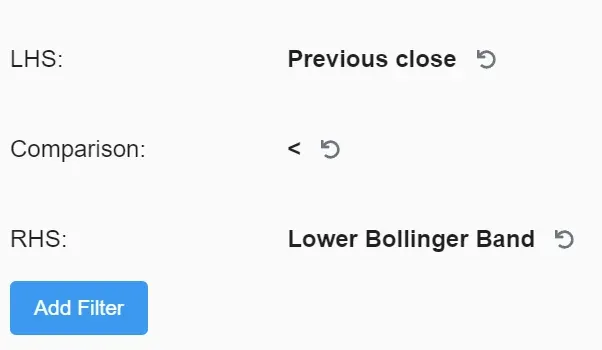
How this custom screen looks in the screener:
Some results after applying this custom expression:
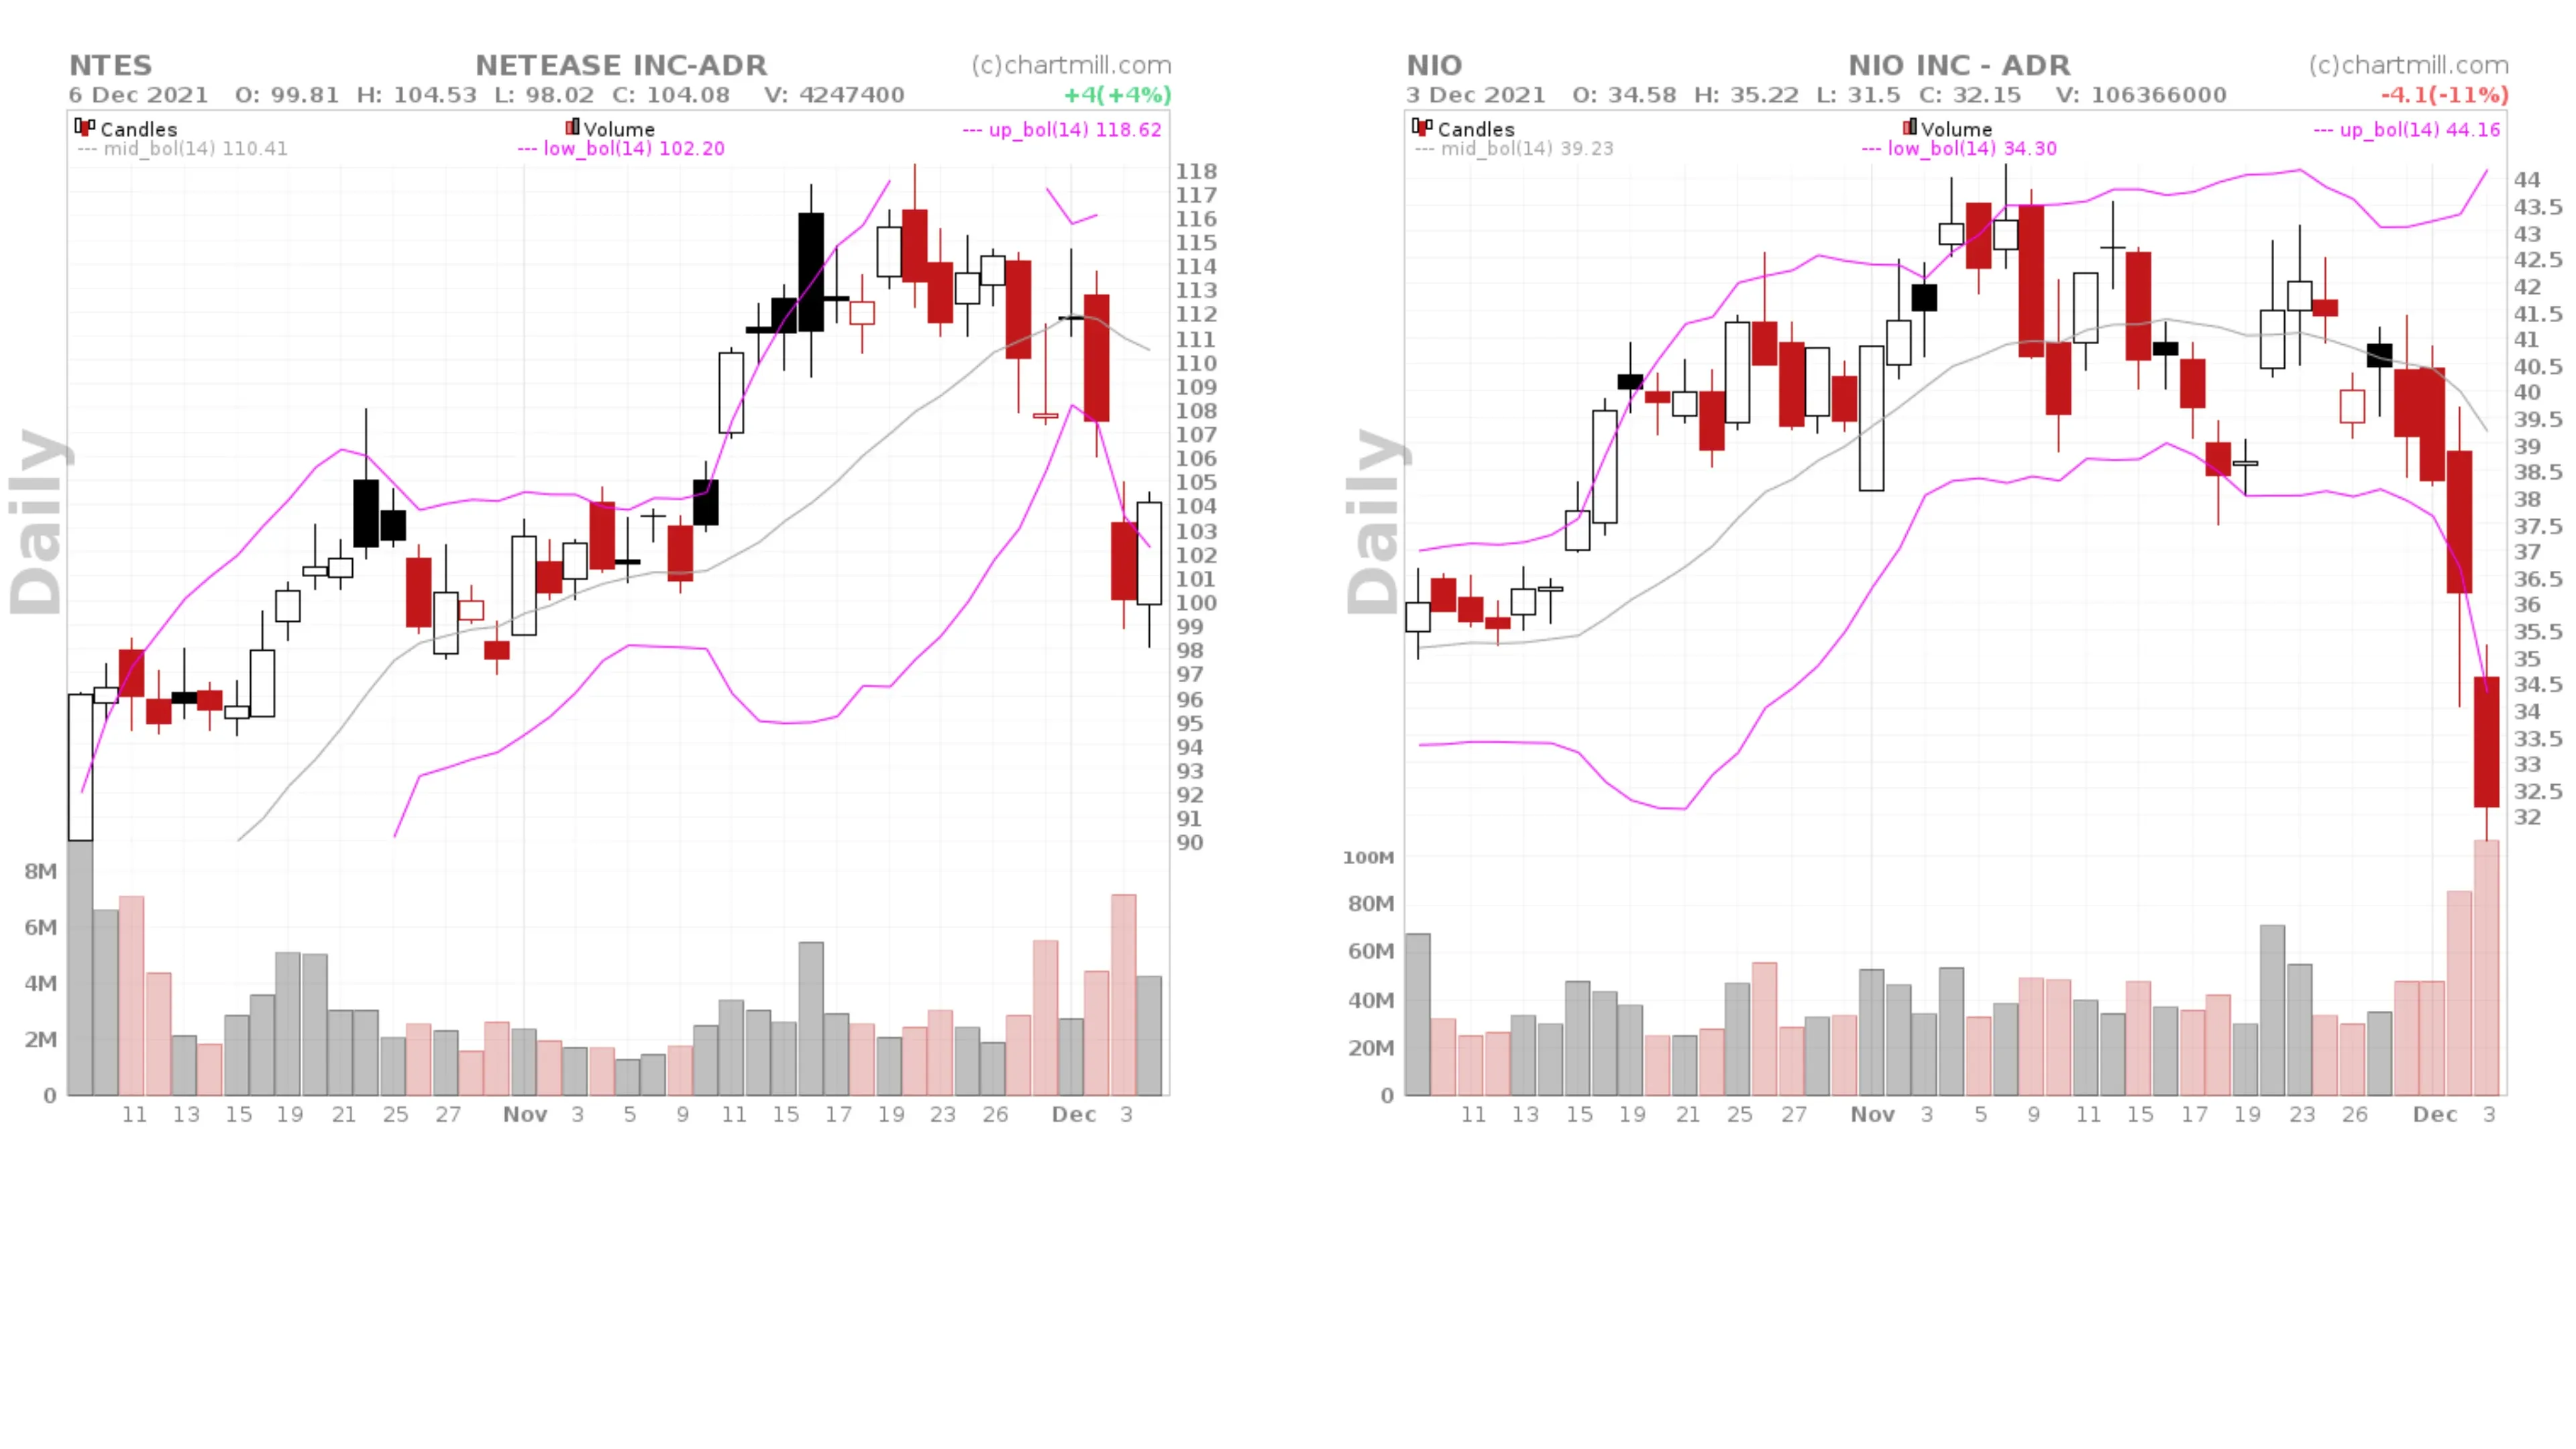 Both charts indeed show that the second to last trading day the price ended below the Lower BB. However, because the last trading day was not yet defined, on the right-hand chart one sees a result where that last candle closes below the Lower BB as well. And that is not the pattern we are looking for.
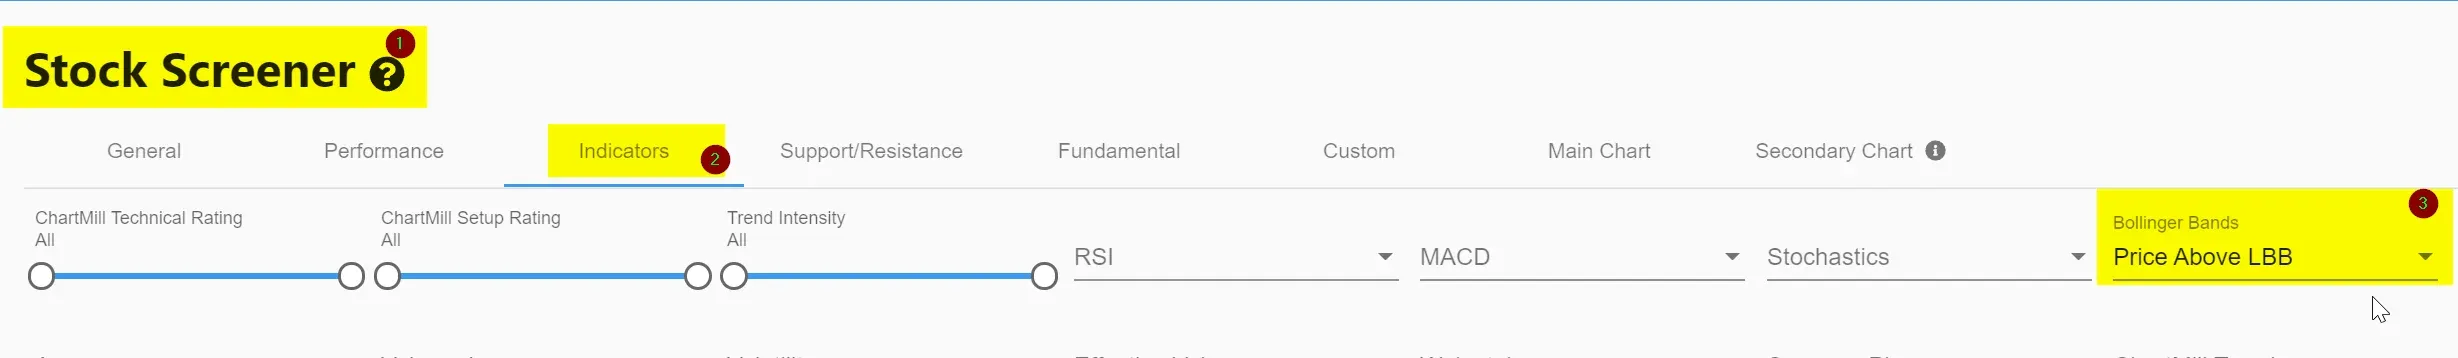
Defining the last trading day (closing price higher than the Lower BB) can however easily be done with the available standard filters in the indicators menu (Price > Lower BB).
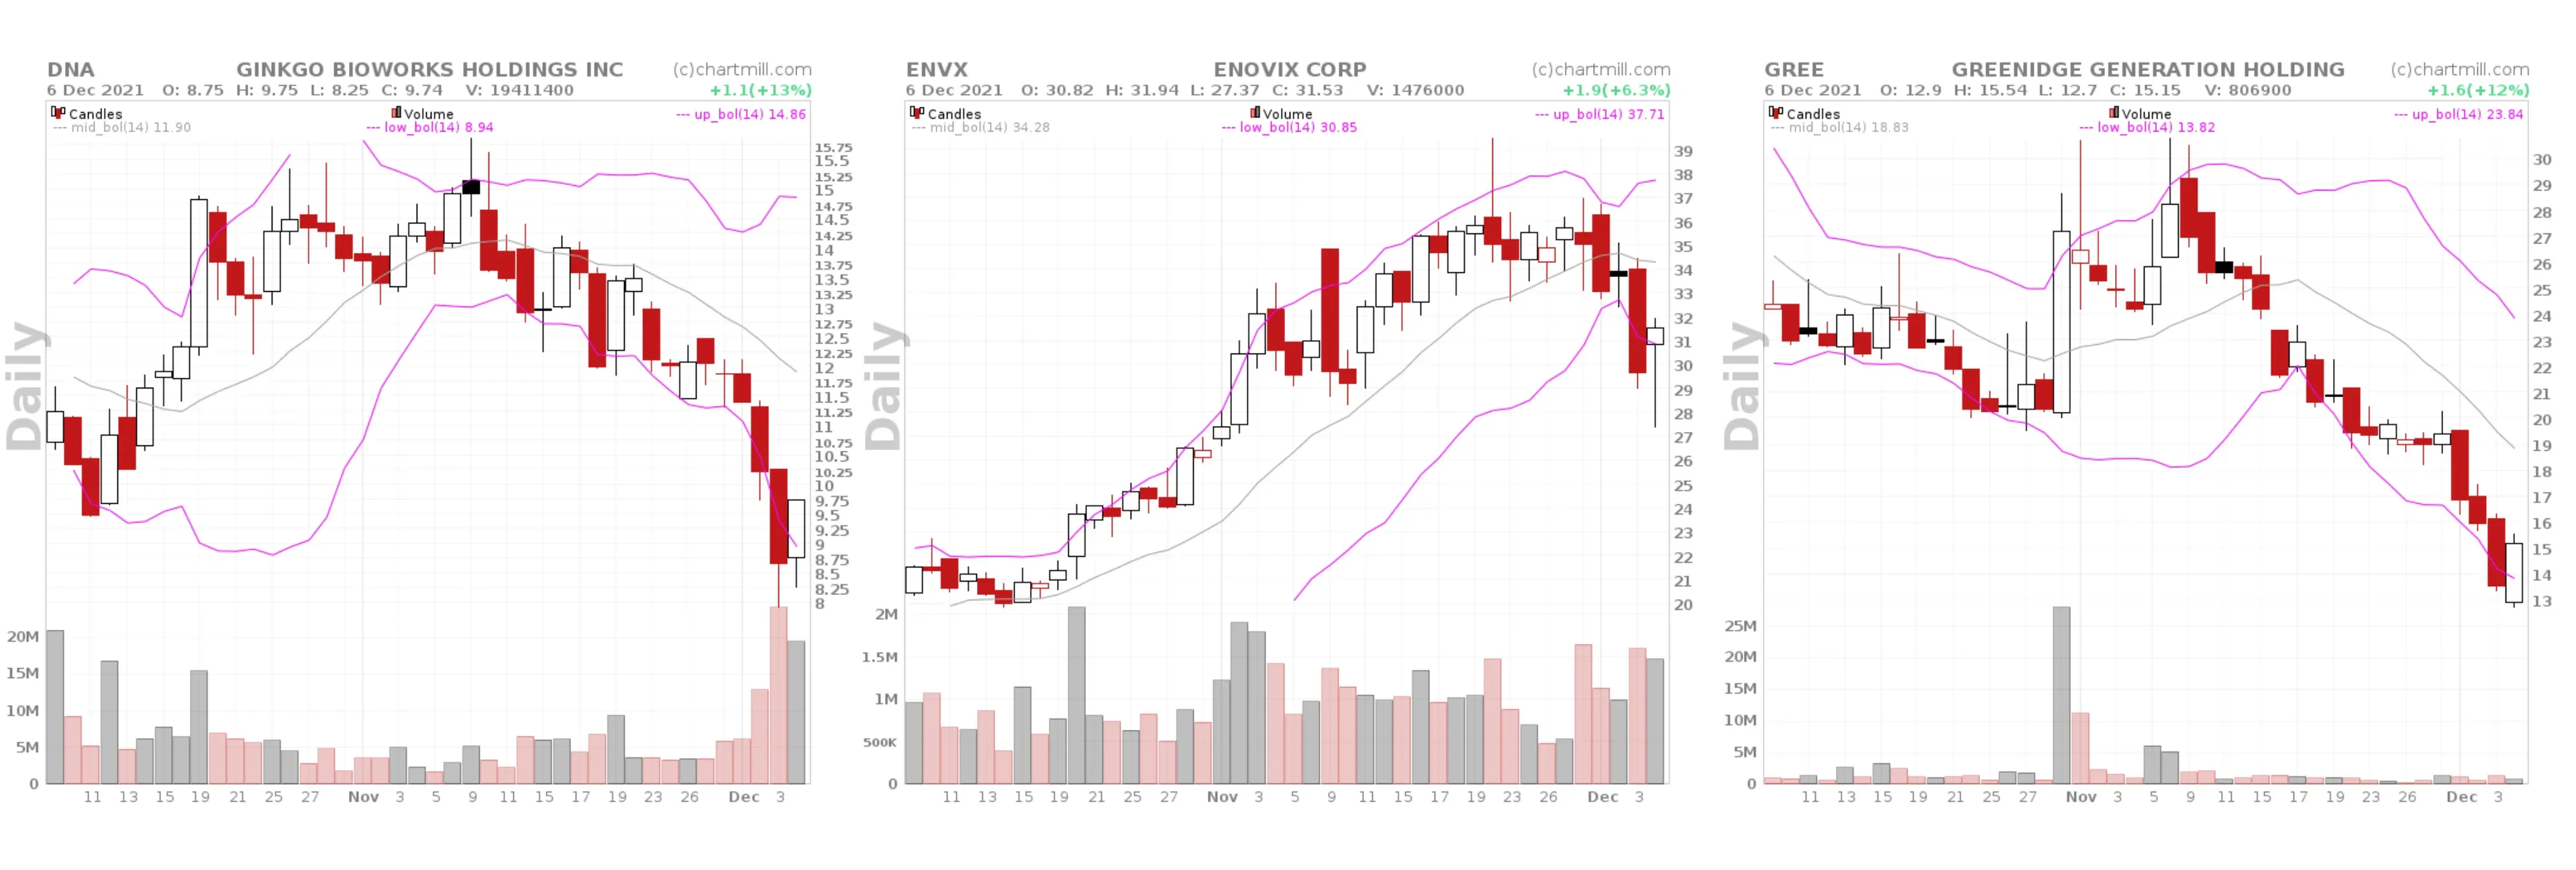
With this combination of a custom expression and standard filter, you only get results like the charts below where the closing price of the last candle is always higher than the Lower BB.
What if you would like to define the last candle in even more detail? Suppose you want to define that the closing price of the most recent candle should not only be higher than the Lower BB but also higher than the high of the previous candle? So what we want to achieve is this:
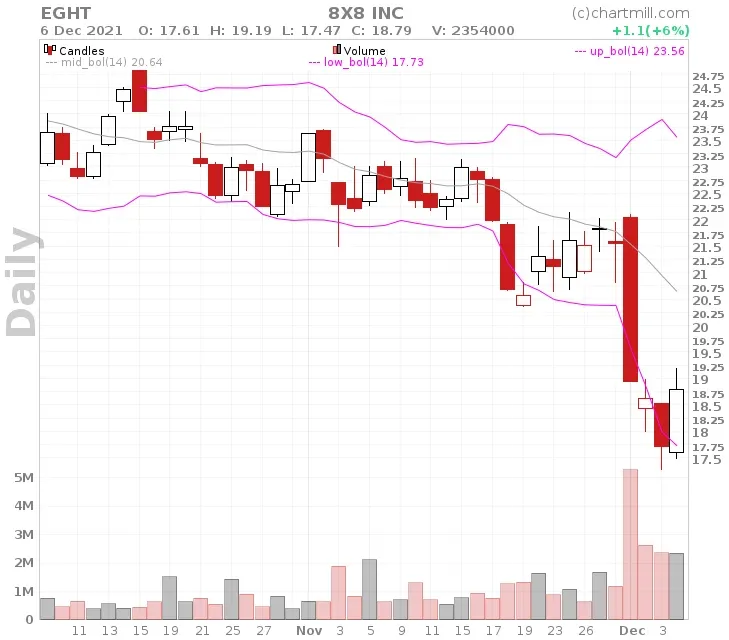
The above chart has the following characteristics:
- The penultimate candle closed below the Lower BB
- The most recent candle has again a close which is higher than the Lower BB
- At the same time the most recent candle has a close which is higher than the previous high
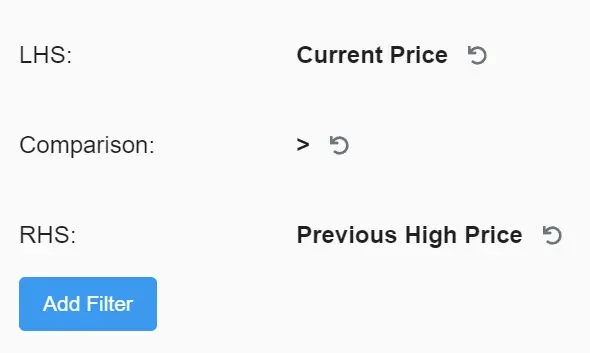
We already defined points 1 and 2 with a custom expression and a standard filter. As for point 3, we also use a custom expression and proceed as follows:
This is what it looks like in the stock screener:
TO CONCLUDE
As the examples above have shown, custom expressions offer unprecedented possibilities for fine-tuning your filters in great detail. You can use them to refine the standard filters but you can also develop completely new filters and price patterns. It is one of the most powerful applications in ChartMill and its possibilities will be further developed in the future. The application might take some time to get used to, but don't let that discourage you from using it. If you have any questions or remarks, feel free to contact us!
Be sure to watch this video where custom expressions are also used.