
One last update before we say goodbye to 2022.
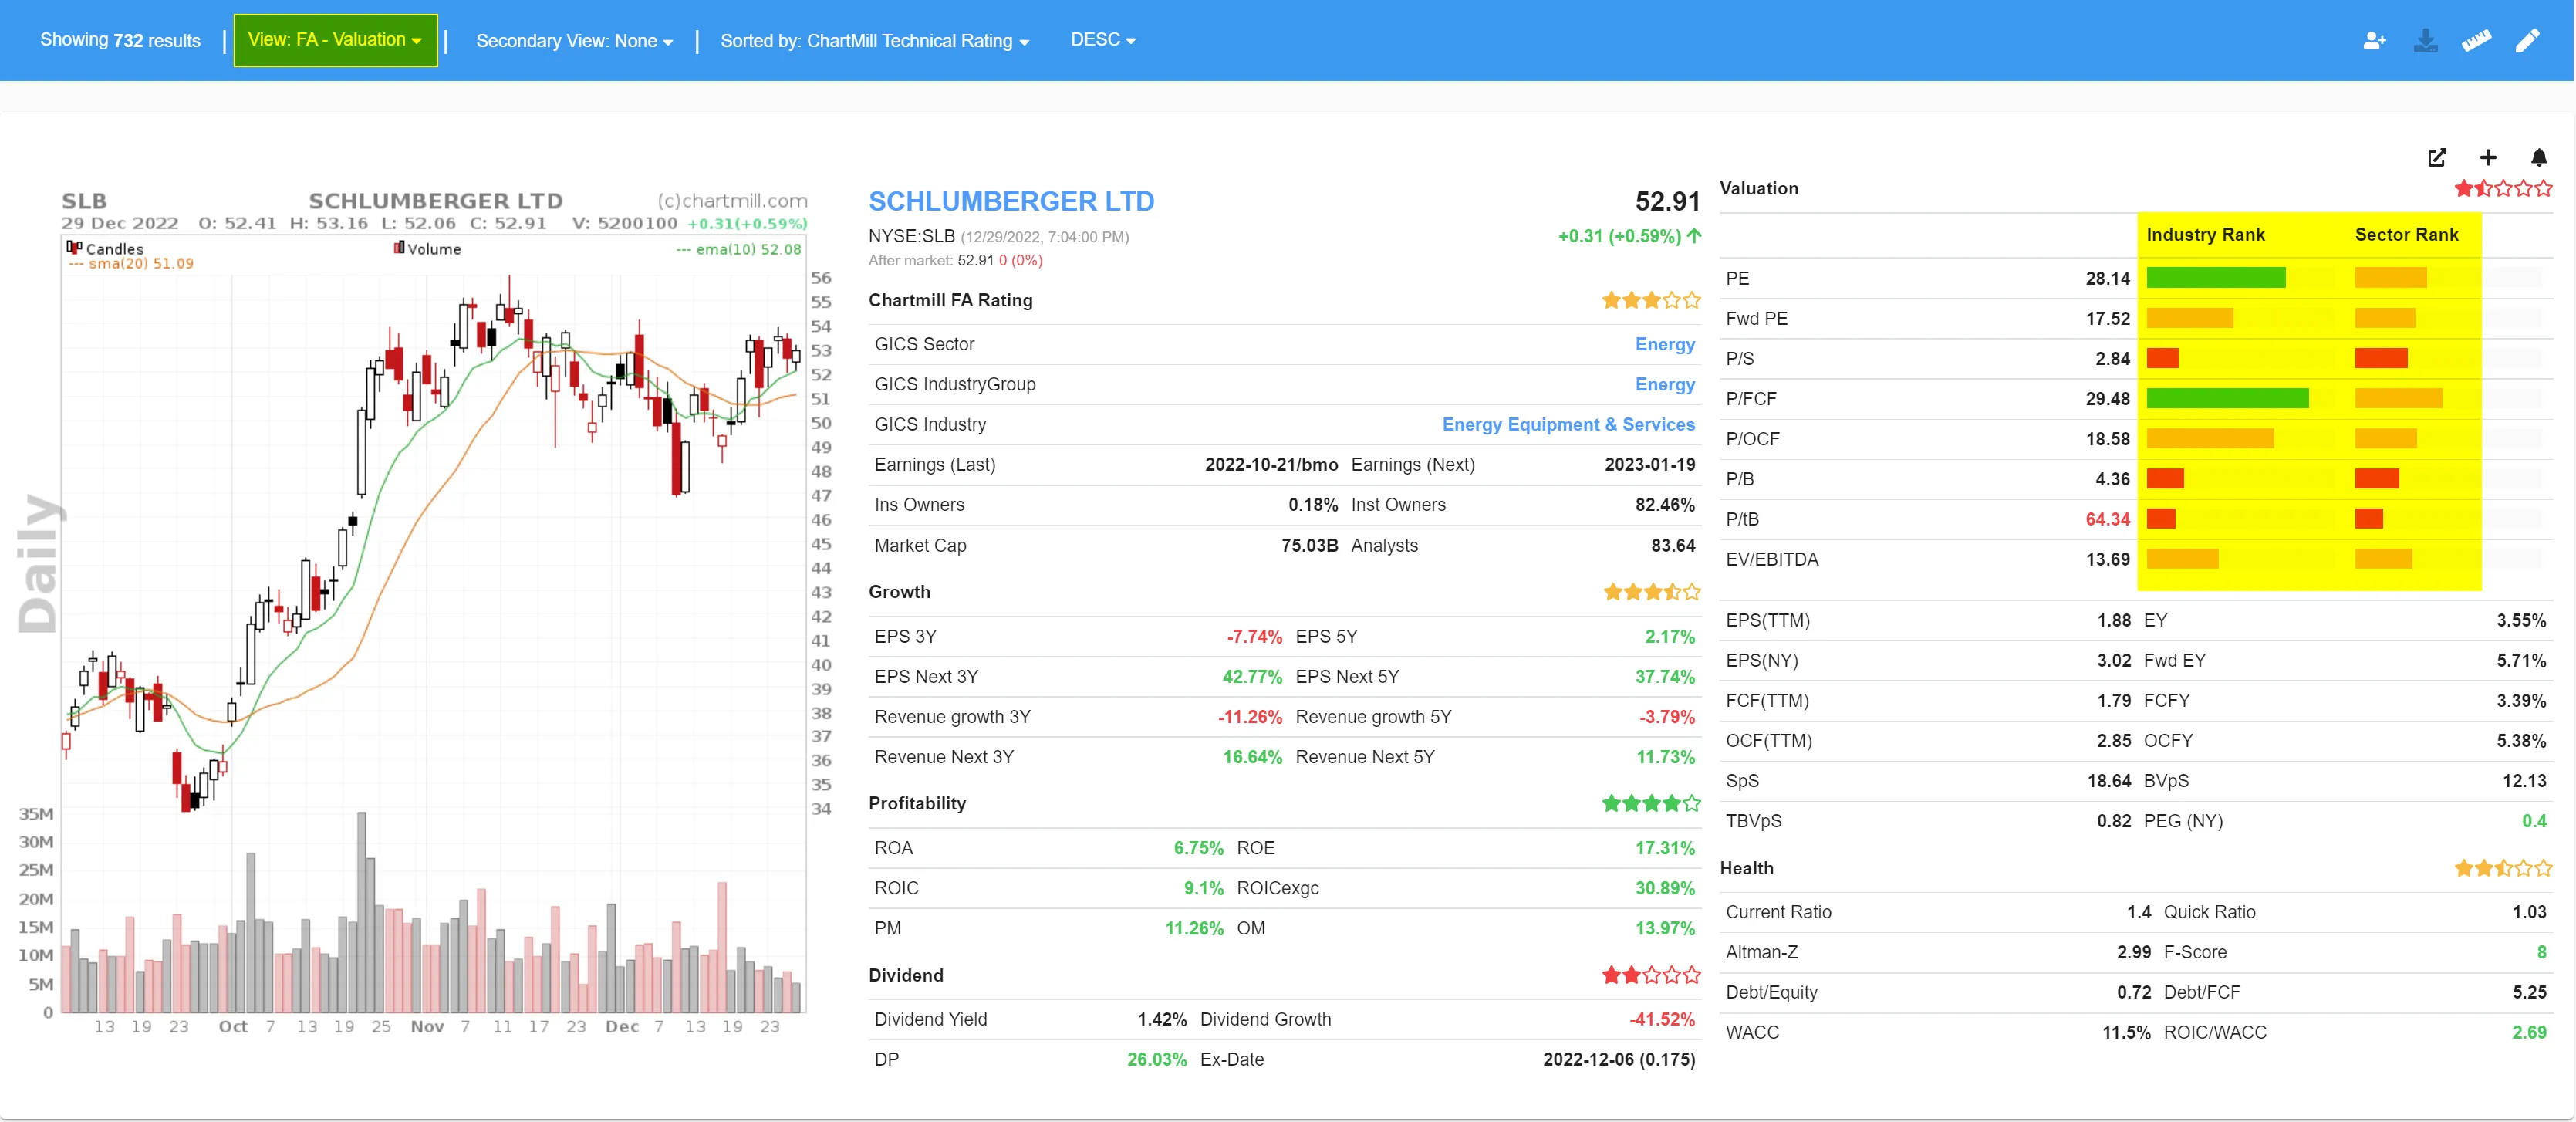
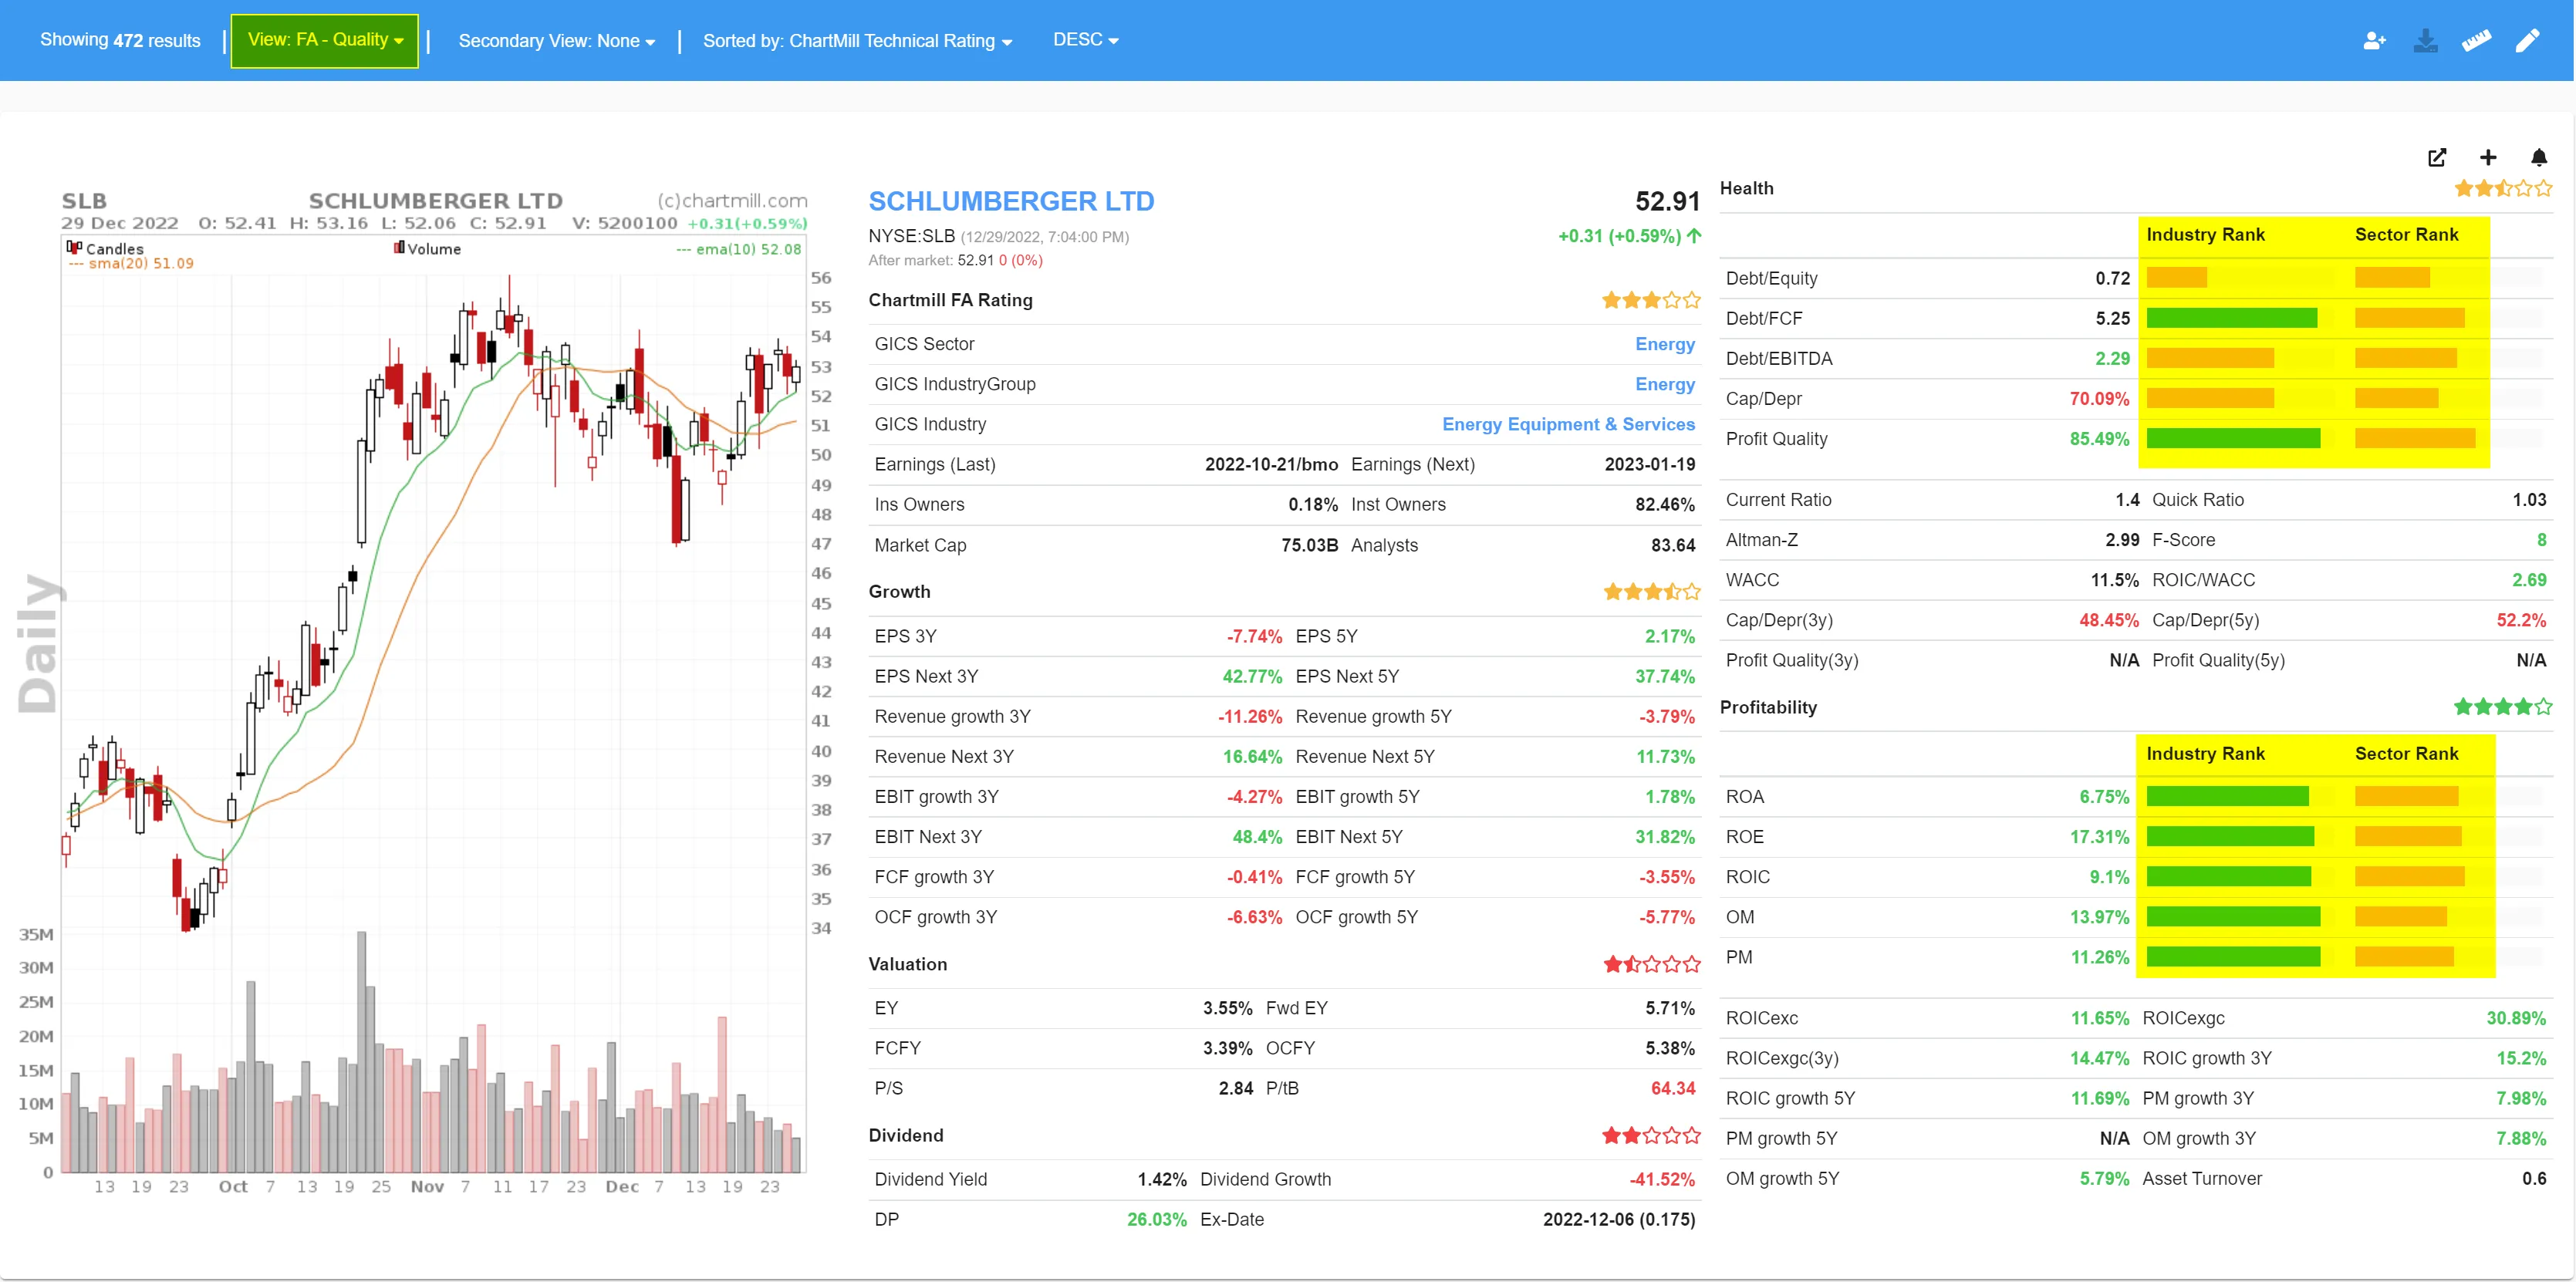
We've added industry and sector rankings for a whole lot of fundamental ratios, both in the viewer and the screener!
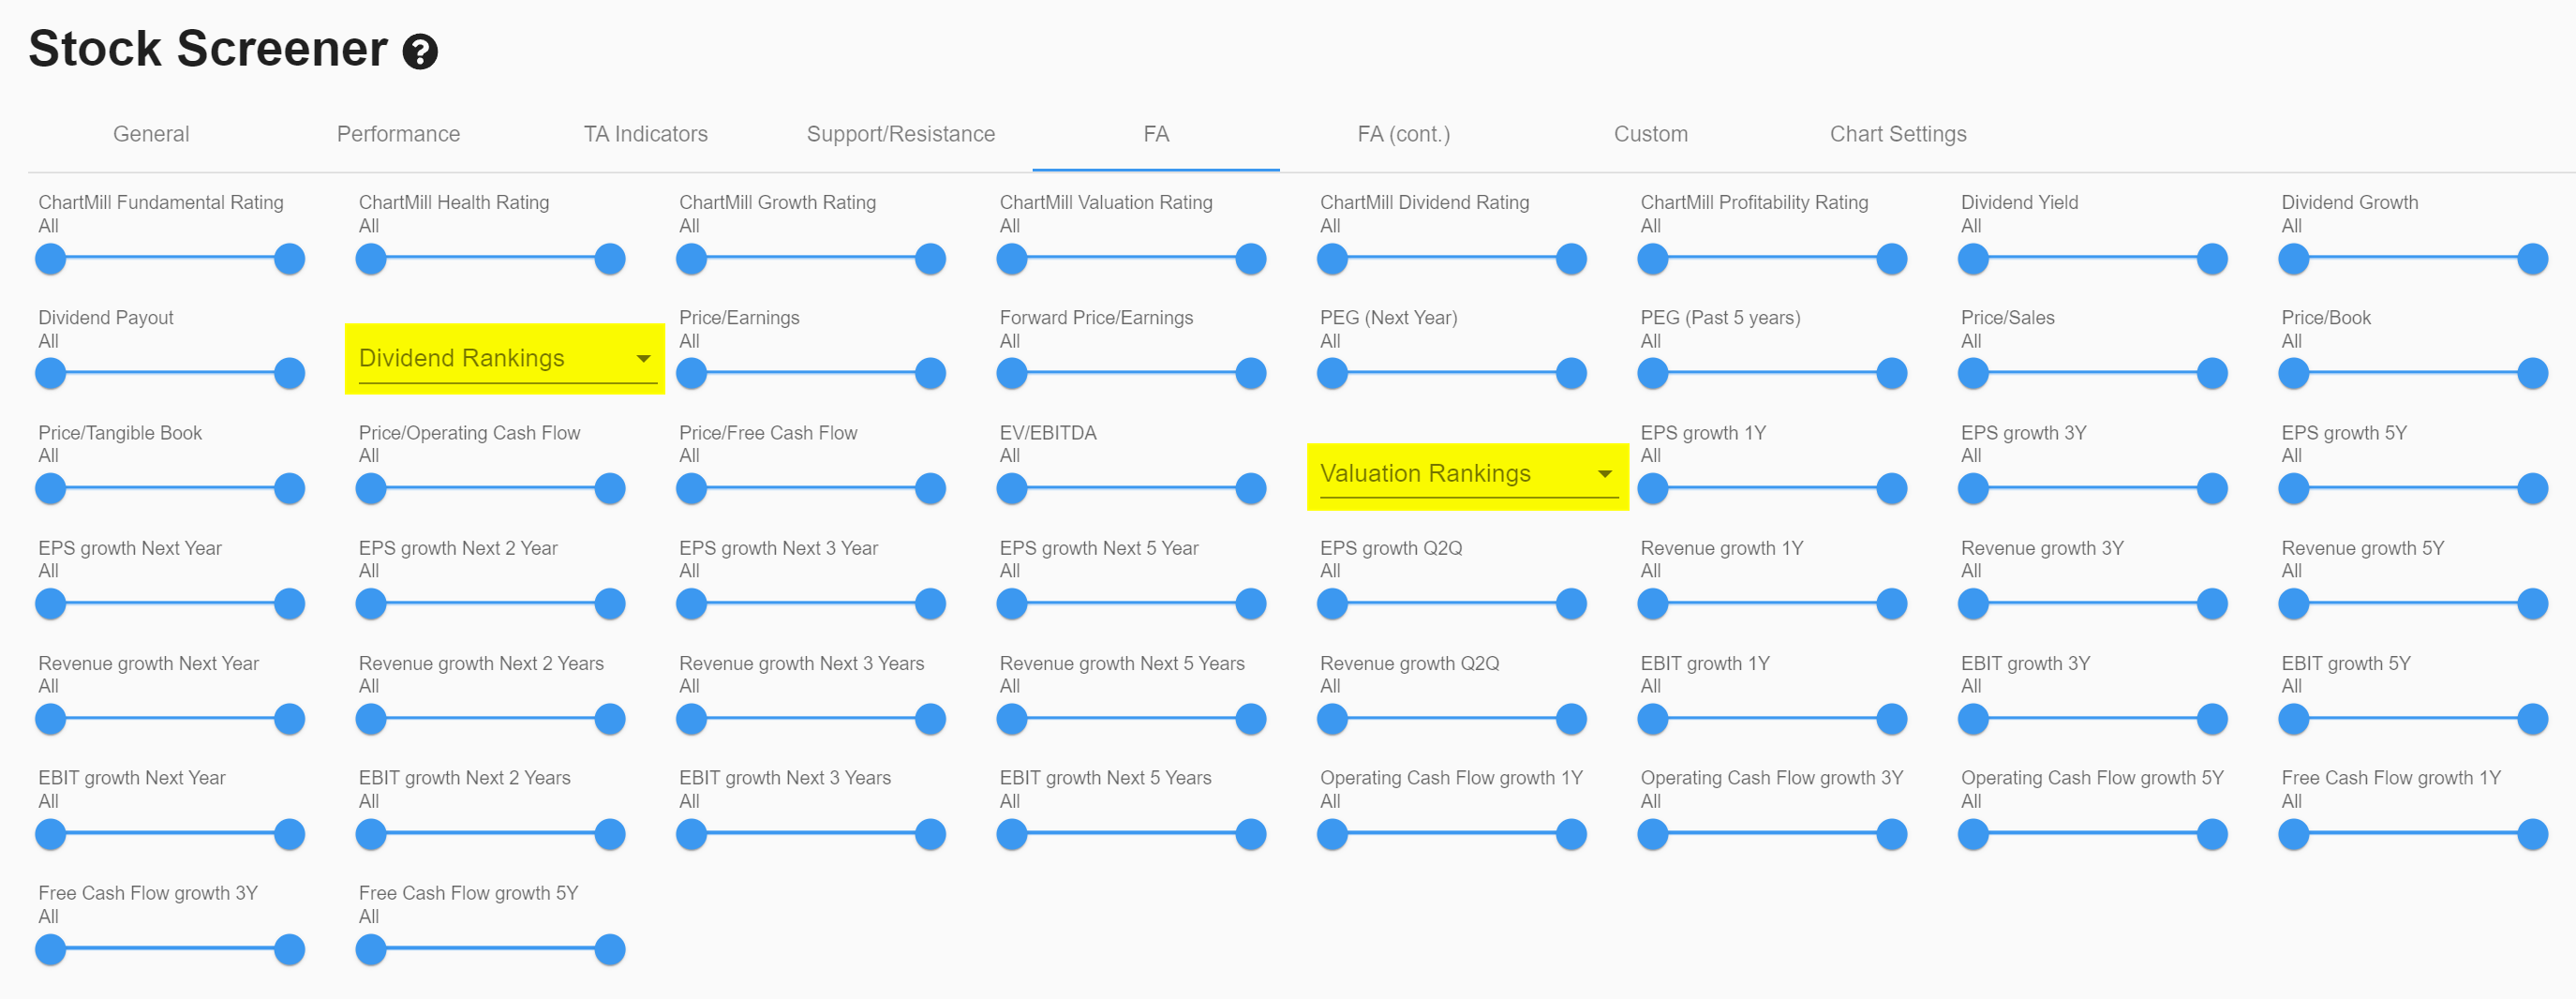
On the screener page, the difference between industry and sector is indicated in the extension of the filter name.
- Irank: Industry Ranking
- Srank: Sector Ranking
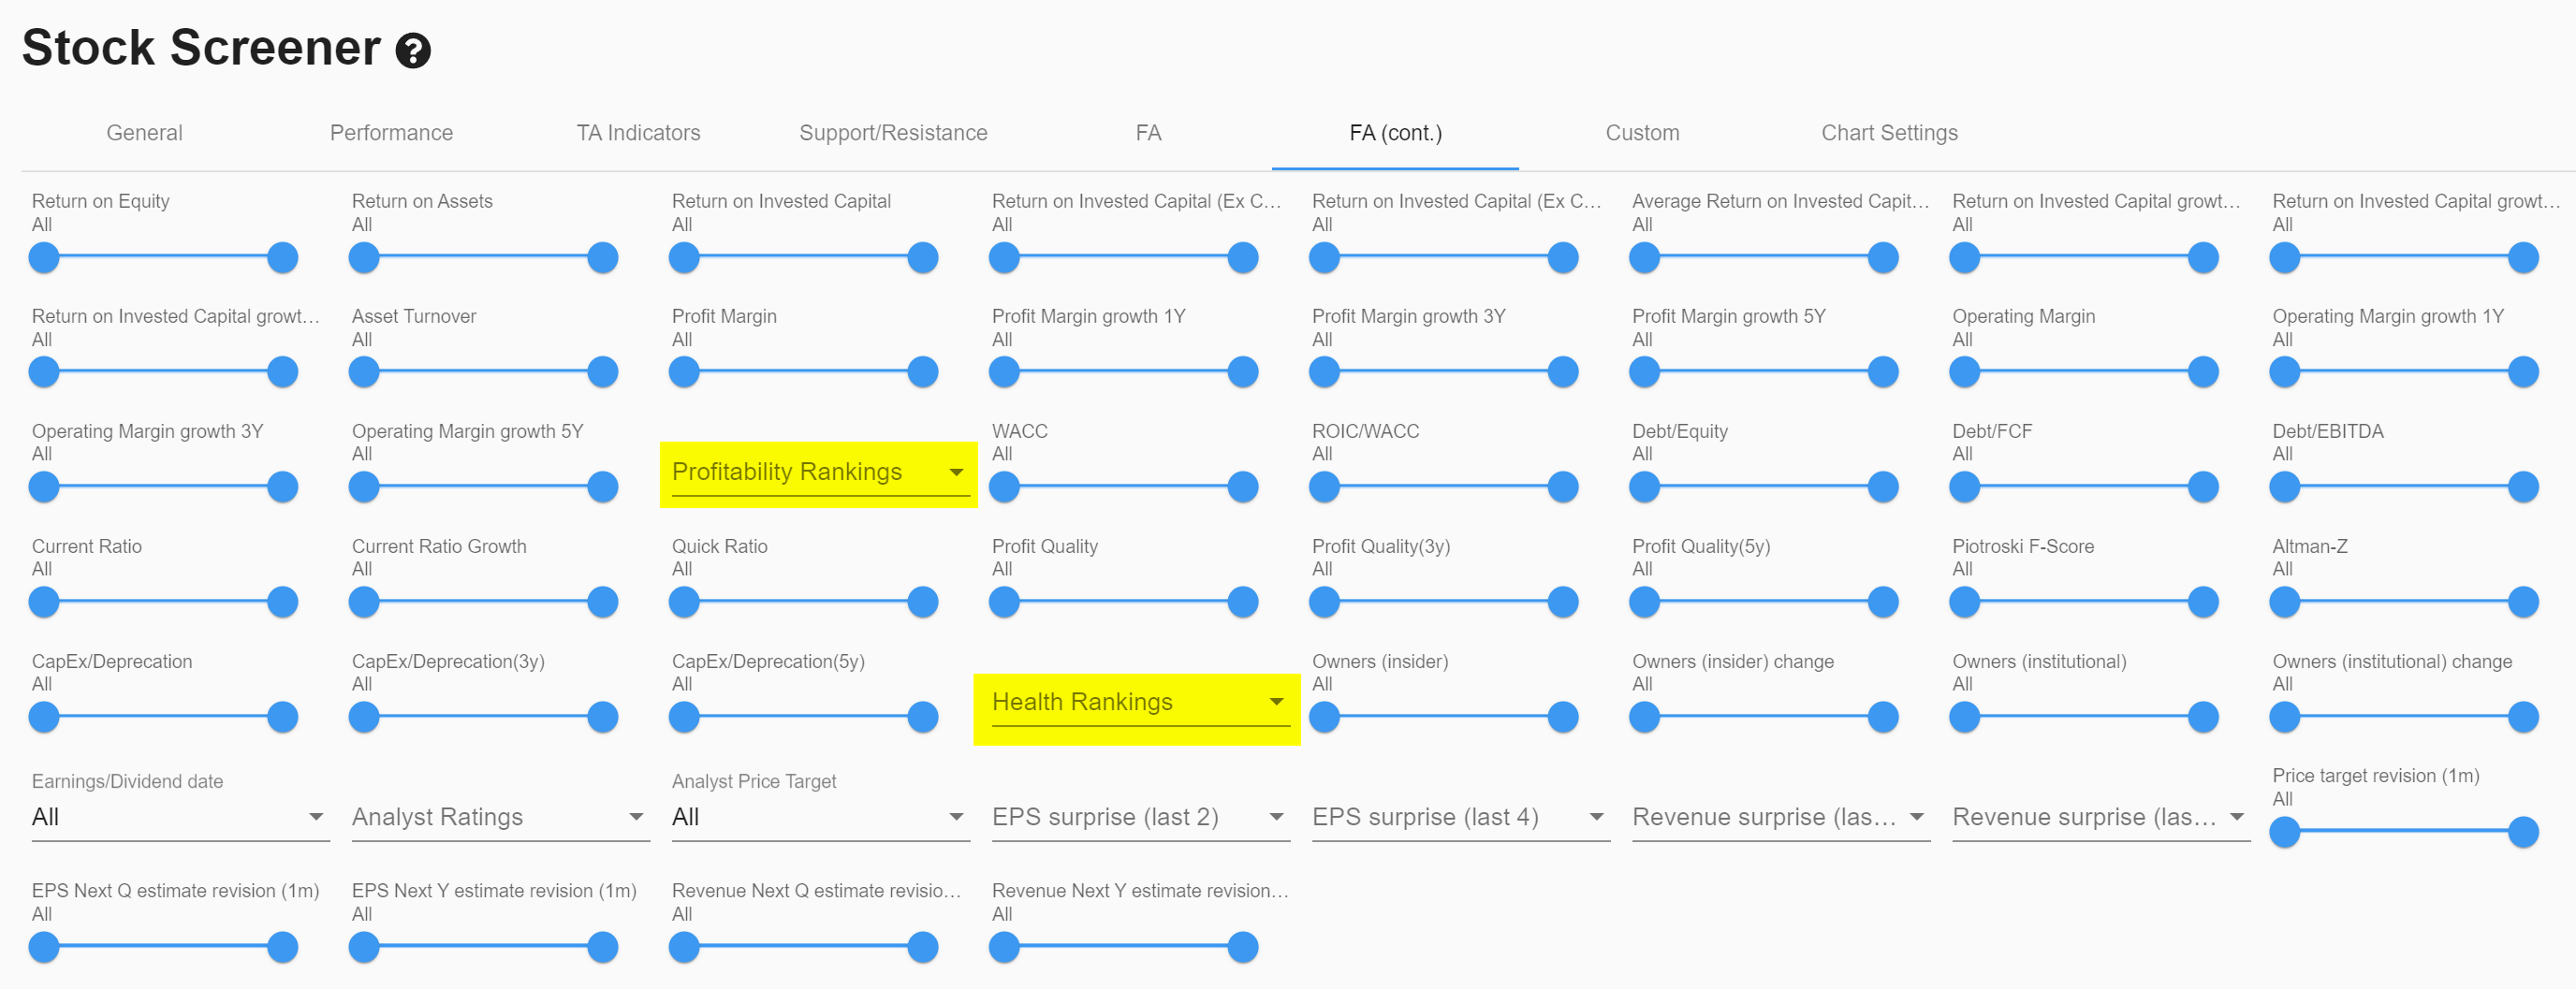
The ratios on which you can rank are divided into four groups:
Dividend ranking
- dividend yield
Profitability ranking
- Return on assets
- Return on equity
- ROIC Exgc (return on invested capital, goodwill and cash excluded)
- ROIC Exg (return on invested capital, goodwill excluded, cash included)
- ROIC (return on invested capital, goodwill and cash included)
- Profit margin
- Operating margin
valuation ranking
- Price earnings
- Forward Price Earnings
- Price/Sales
- Price/Free Cash Flow
- Price/Operating Cash Flow
- Price/Book
- Price/Tangible Book
- EV/EBITDA (Enterprise Value/ Earnings before Interest, Taxes, Depreciation, and Amortization)
financial health ranking
- Current Ratio
- Quick Ratio
- Altman-Z
- Debt/Equity
- Debt/Free Cash Flow
- Debt/EBITDA
- Profit Quality
- CapEx/Deprecation
Some of these are visible by default when you set the view to 'columns' and then select ' FA quality' or 'FA valuation'.
But all these ratios are also available to put together your own custom view via the 'create custom view tab'.

The great thing is that all these ranking ratios can also be used as screening filters.
For example, this list shows only US companies from the consumer discretionary sector (minimum mid caps, price higher than $10 and a minimum trading volume of 300,000) with a ROIC and debt ratio rank > 90.
So these are companies that belong within the top 10% in terms of ROIC (compared to all other companies within the same industry) and at the same time have a very low debt ratio (lower than 90% of industry peers).
These new ChartMIll features allow you to very quickly and accurately compare companies within their specific industry or sector for numerous fundamental parameters.