Beginning of a new month, time for some minor yet welcome changes and additions to the stock screener....
ADX-indicator added for screening
First thing is the addition of a technical indicator for the screener. The adx-indicator was already part of the list of indicators you can plot on a chart but now it is also possible to use it as a screening filter.
You can find the ADX filter indicator - just like the other available screening indicators - on the stock screener page, more specifically in the menu 'indicators'.
The following filters are possible:
- rising or falling indicator
- above or below a certain indicator value
- upward or downward crossing of a certain indicator value
Specific filters for weekly charts are also possible.
A screening example:
'Create custom view' button directly available on the stock screener page
To create a personal custom view, you used to access the dropdown menu in the blue horizontal bar on the stock screener page. That is still possible but now it can be done a lot faster since we've added a 'create custom view' button on the blue horizontal bar itself (on the right side of the bar next to the (Big Charts' item).

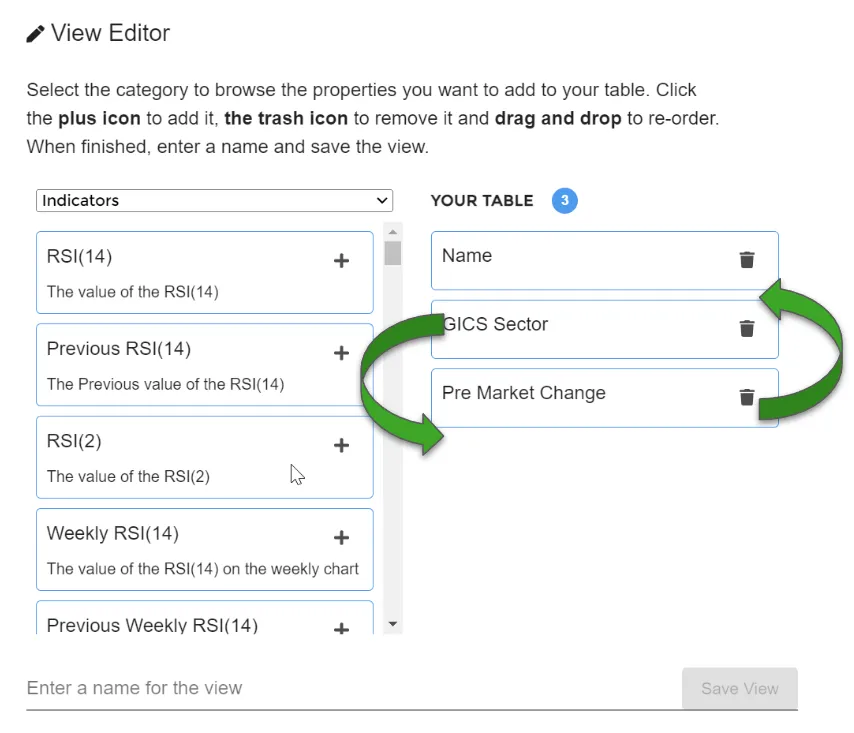
Drag and drop feature added when creating a personal custom view
We have implemented the drag/drop to re-order your fields in custom views. This was a much requested update and it had been on our to-do list for a while.
The ChartMill Team
