
Those who invest are obviously looking for returns, as much and as quickly as possible.... So you want to buy the ones that perform best, outperforming their sector peers or the market in general.
To find such quality stocks there are several ways to do so but in this article i’ll take a closer look at one important measuring tool that should not be missed, the Relative Strength of the stock in question.
(Would you rather watch a video on this topic? Click here!)
When using relative strength one is actually going to compare the value of a stock to another stock, the entire sector or even an index (the S&P500 for example). The stronger the stock performs relative to its sector peers or the market in general, the stronger the relative strength of that share is.
Mind you, the relative strength discussed in this article is totally different from the RSI indicator. The latter is a 'technical momentum indicator' that indicates whether a share is 'overbought' or 'oversold'. The RSI also measures the relative strength, but does so from a different perspective. The share is compared with the recent performance of the same share.
Within Chartmill there are no less than 3 different relative strength indicators available, two of which you can also use as screen filters.
Dorsey Relative Strength
This form of Relative Strength was described and used in the book “Point & Figure Charting” by Thomas Dorsey. Dorsey was using XO-charts, but one can also interpret it on a regular chart.
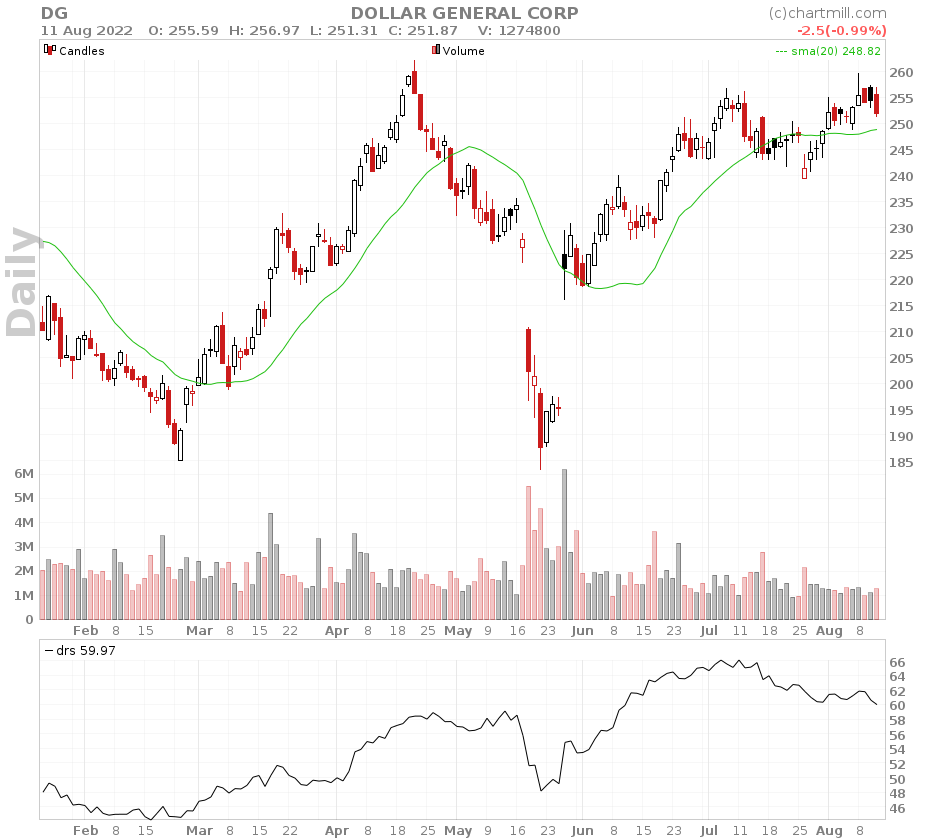
if this indicator rises the stock is outperforming the market and if it declines, the stock underperforms the market.
More in depth information can be found in this article on our website.
Mansfield Relative Strength
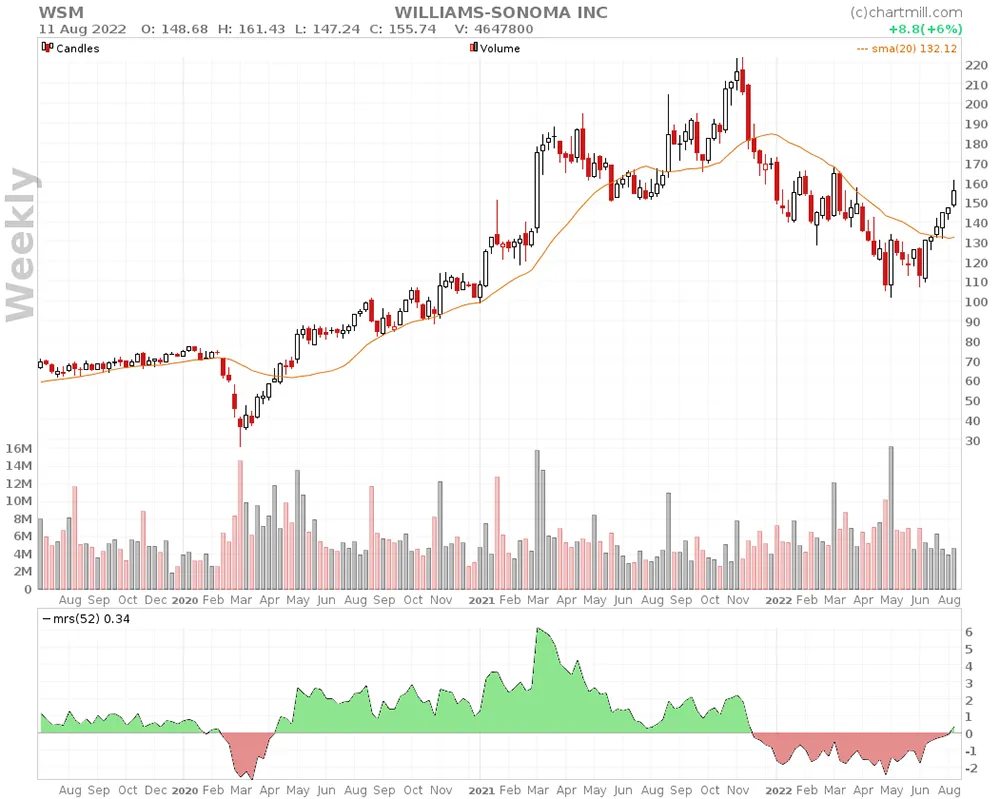
This variant of Relative Strength was used in the book “Secrets For Profiting in Bull and Bear Market” by Stan Weinstein and he was using the indicator mainly on weekly charts.
In this separate article you can read what the difference is with the Dorsey Relative Strength. However, the intent of the indicator is the same. Both indicators look for stocks that outperform the market in general. Only the rising or declining of the indicator matters for this.
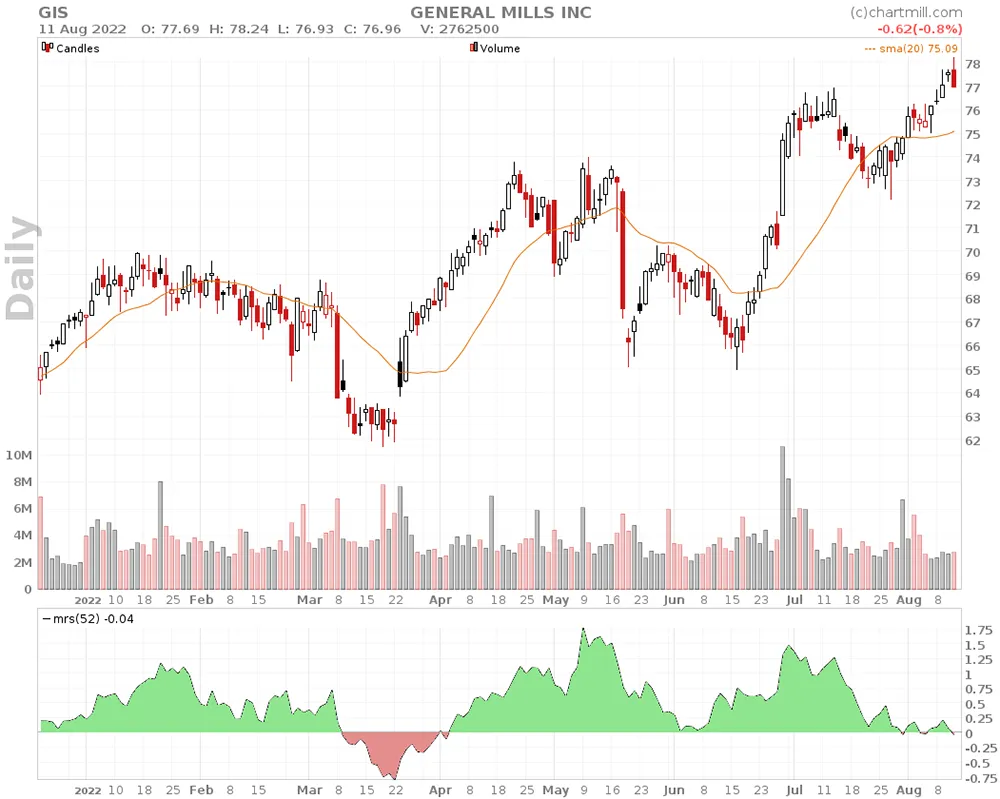
Stan Weinstein insisted that breakouts out of a base had to go together with rising relative strength. The Mansfield RS needs to be rising close to or above 0.
Mansfield RS filtering
There are two filters available in ChartMill. The first filter (Mansfield Relative Strength) allows you to set the minimum or maximum value of the Mansfield relative strength. If you move the slider from left to right you set a minimum value. If you move the slider from right to left then you define a maximum value.
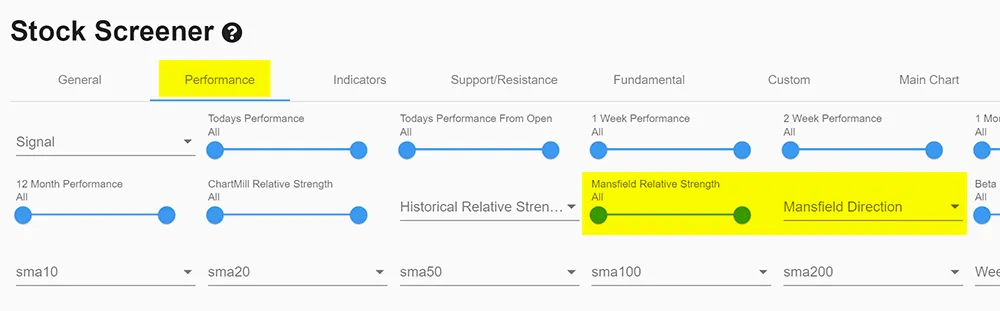
The second filter (Mansfield Direction) allows you to determine that the mansfield value should rise or fall, be below or above the zero line, and you can even scan for a specific upward or downward crossing of the zero line.
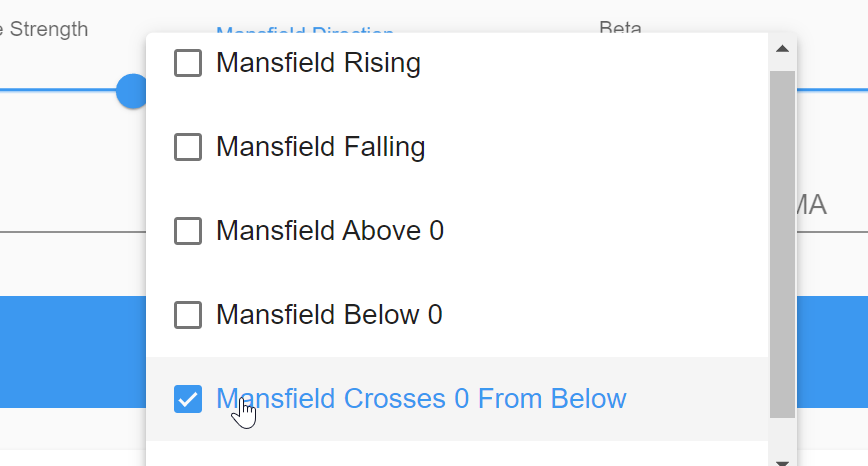
Upward crosses of the indicator are particularly interesting for spotting breakout setups.
However, keep in mind that these screens are based on the weekly charts. So view the results on the weekly timeframe for proper interpretation. If necessary, you can change this by clicking on the 'main chart' menu and then selecting 'weekly' from the dropdown menu under the 'timeframe' tab.
ChartMill Relative Strength
At ChartMill we assign a Relative Strength rating number to every stock in our database. The relative strength number of a stock (=CRS) indicates how well the stock has been performing over the last year compared to all other stocks in our database. The maximum number is 100, the minimum number is 0. When a stock has relative strength number 100, it means that it outperformed all other stocks in the database. When the value would be 90, it means that this stock outperformed 90% of all other stocks.
More information can be read here
ChartMill RS filtering
The filters related to Relative Strength are next to the Mansfield Relative Strength filters also on the performance tab of the stock screener.

The following filters are available:
- A slider (ChartMill Relative Strength) that allows you to filter on the minimum and maximum ChartMill Relative Strength value. This filter is similar to the slider of the Mansfield filter.
- And also Filters related to the 13 or 52 week high or low of the CRS number (Historical Relative Strength). This allows you to look for stocks with an improving relative strength.
ChartMill RS Sorting
The stock screener also allows to sort by Relative Strength for each filter or combination of filters you select. This allows for instance to rank the output of any screen according to Relative Strength.
First open the drop down menu in the horizontal blue bar, next to 'sorted by'.
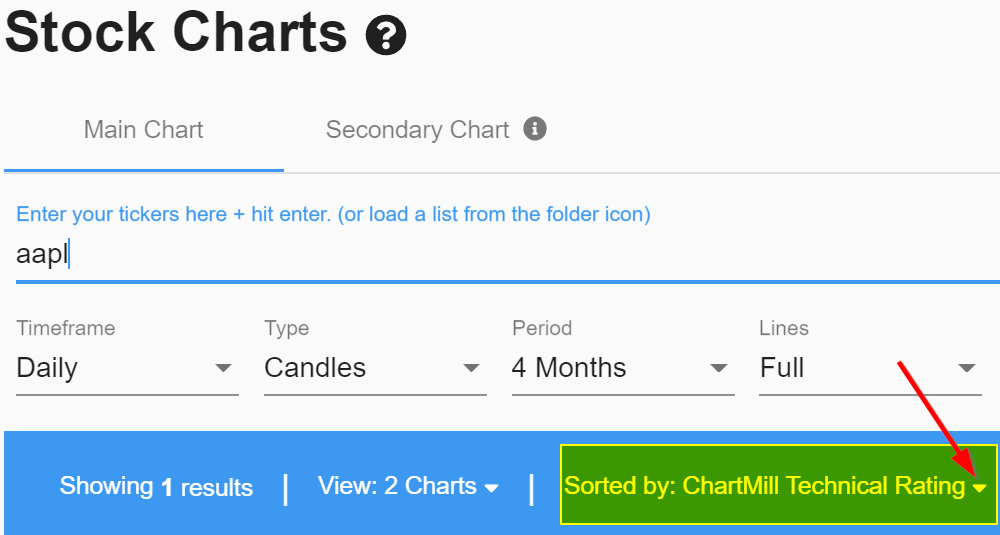
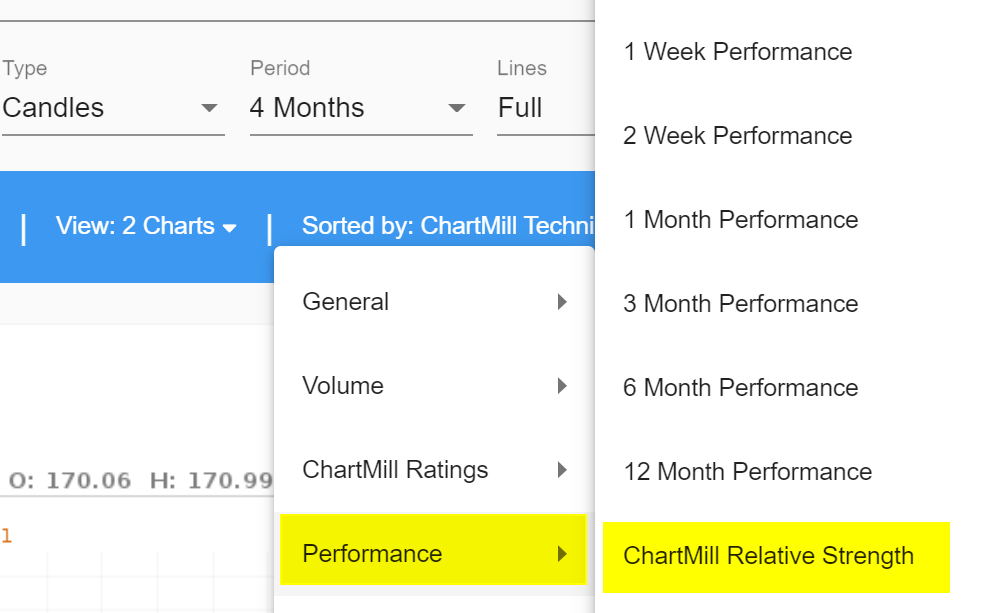
You can find the criteria under 'performance' in the sorting options.
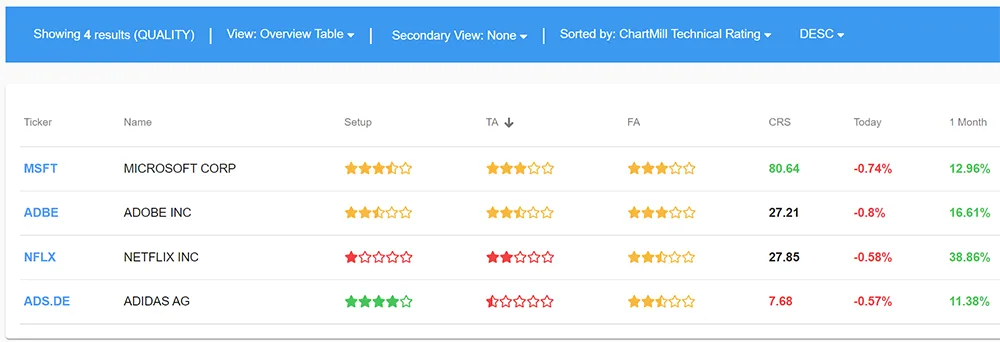
The relative strength number is also displayed in the tables, the technical views or your custom views.
A video is also available with this article, which you can watch via this link.