Quick Scan of an individual stock or even an entire watchlist
ChartMill offers very extensive technical and fundamental filtering capabilities to accurately find stocks that meet all your desired criteria. To quickly scan a stock, you can use the 'Analyze your Stock' function in ChartMill.
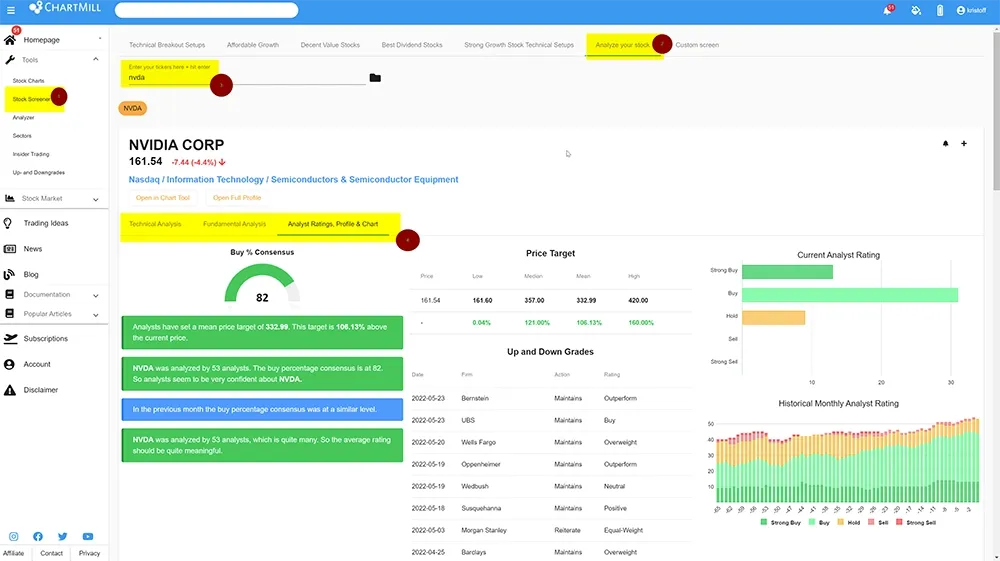
You will find the Analyzer in the main menu on the left. In the next screen, select 'Analyze Your Stock'. Next, enter the ticker of the stock that ChartMill should analyze and press 'enter'. Depending on the market to which the stock belongs, you can consult a technical and fundamental analysis, as well as the analyst ratings, a short summary about the company and a basic graph.
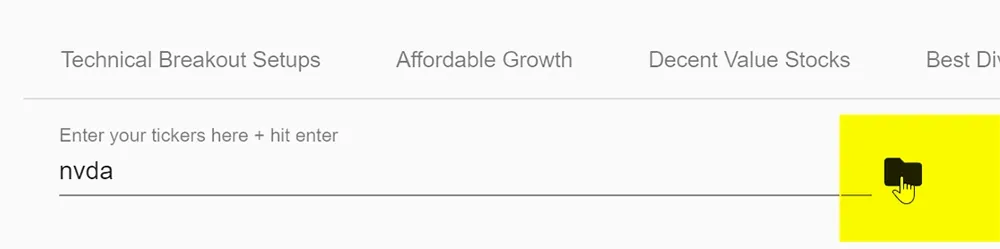
Extra Tip: If you use watchlists in ChartMill, you can have ChartMill scan all stocks in your watchlists at once. Just click on the map icon in the ticker field and select the watchlist you want to have analyzed.
Opening watchlists
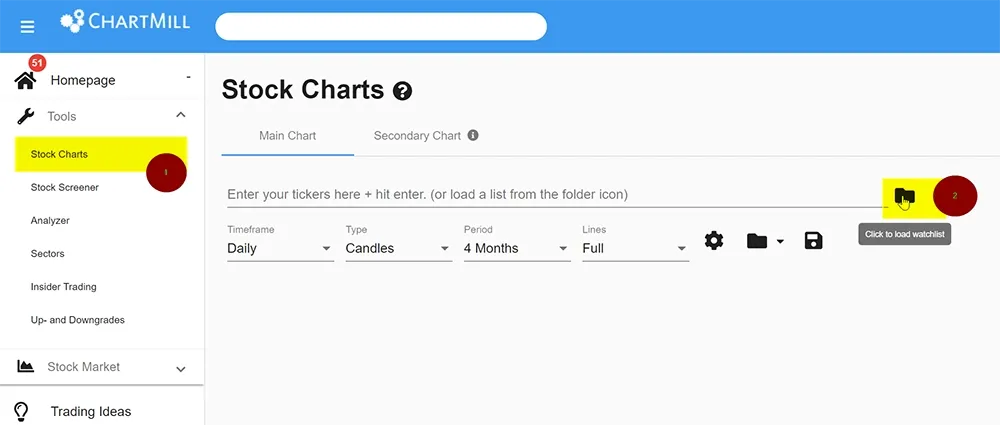
Watchlists are an important part of ChartMill to quickly and efficiently access your selected stocks. You can access your watchlists from the 'My Account' tab when you click on your username in the upper right corner. But there's also a faster way. Click on the 'Stock Charts' tab in the left main menu. In the subsequent ticker screen, click on the folder and select the desired watchlist to open it.
Simultaneously analyze two charts of one stock
Did you know that it is possible to view two different timeframes of one stock at the same time? Very useful to analyze or compare the stock on the short and medium or long term. For example, you can compare the stock on the daily and weekly chart or compare an intraday chart with the daily chart.
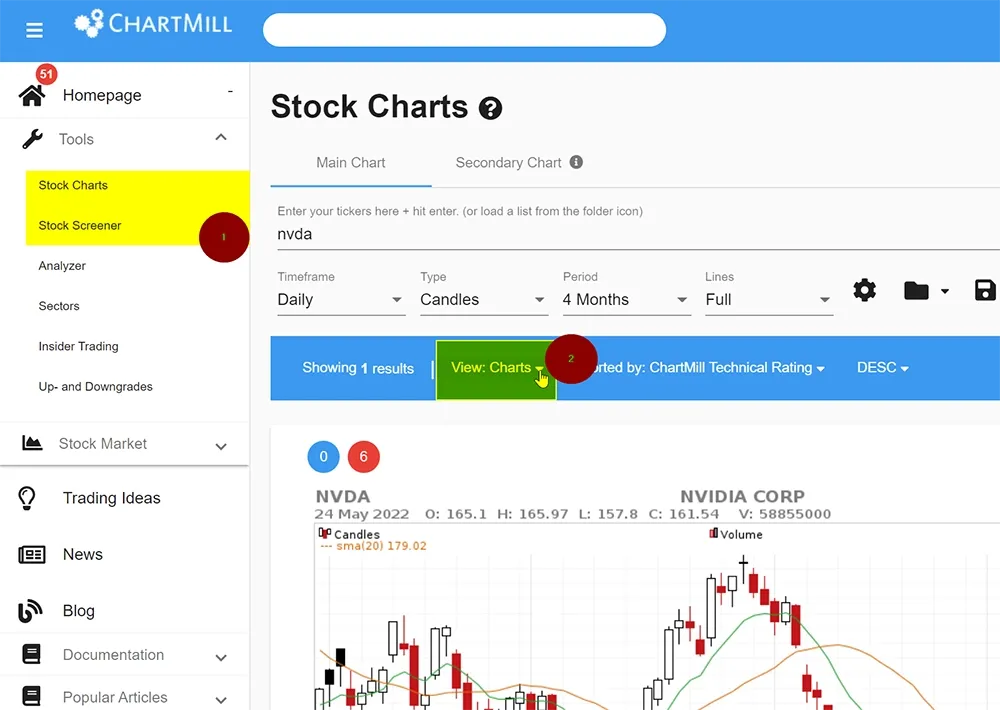
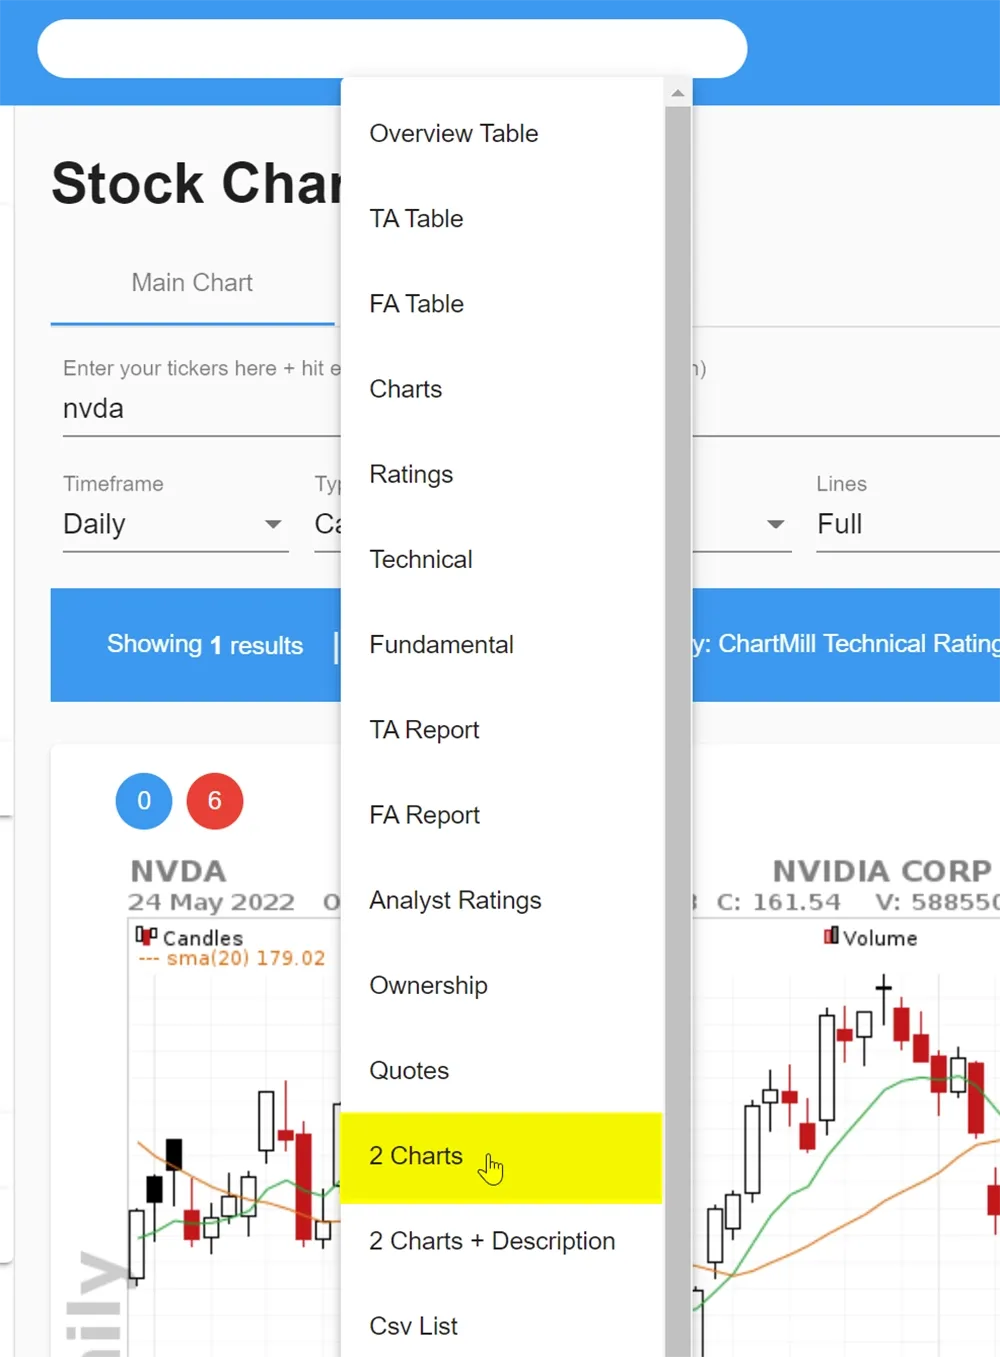
You can use this function on the stock screener or stock charts page. In the horizontal bar, click on the inverted triangle next to view and then select '2 Charts'. Then click on 'Charts per line' and select 2. Both charts can then be adjusted individually in terms of timeframe or specific 'overlays' and 'indicators' can be added via the 'main' and 'secondary chart' buttons.
Favorite trading ideas
The 'Trading Ideas' section is an ideal starting point to develop your own strategy based on existing trading filters. However, there are many ideas as each chartmill user can publish his own trading ideas. In order to keep the overview, there is the possibility to filter the trading ideas via two selection boxes at the top where you can set a number of predefined choices.
There is also the possibility to set up a list of favourites. To add a trading idea to your list of favourites, you have to click on the heart.
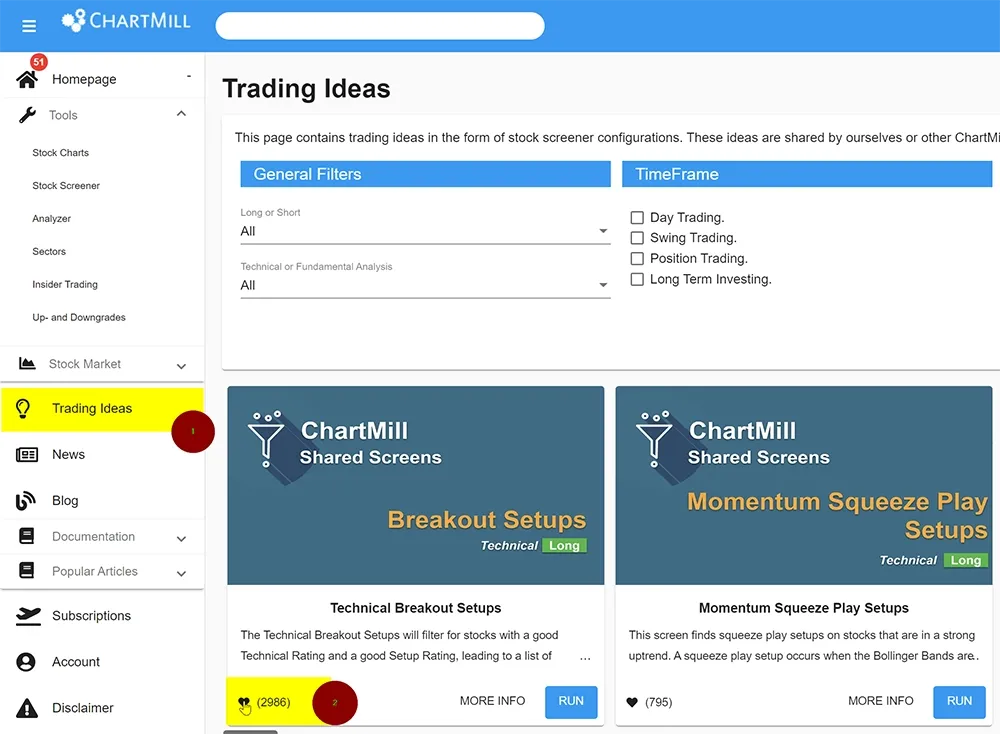
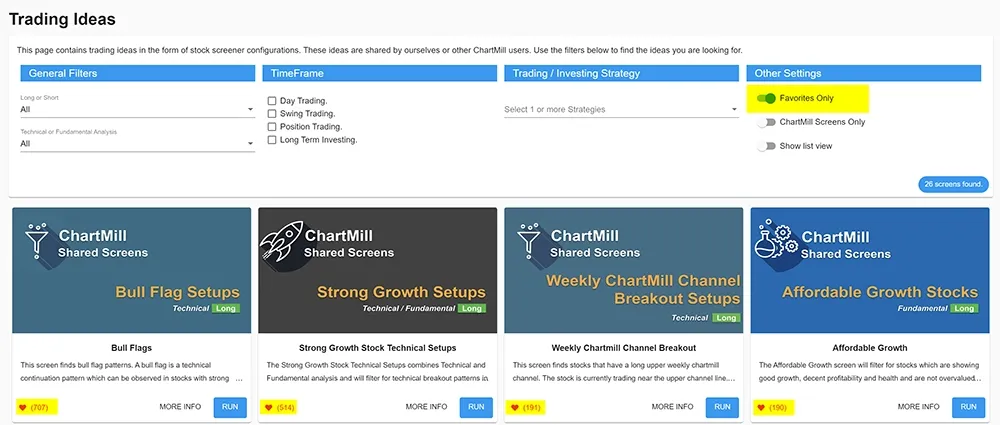
By doing so the idea will be marked as favourite. Once you've marked all your favourite trading ideas in this way, you'll only have to tick the option "Favorites only" on the page itself at the right top corner. This way only your own favorite 'Trading Ideas' will appear.
Saving chart configurations
ChartMill has a large arsenal of indicators and overlays that can be used to annotate price charts. No doubt there are some of these that you use over and over again. That's why ChartMill offers the ability to save your used chart settings. You can even create and save multiple separate presets for easy recall later.
In the left main menu, click on the 'stock charts' tab. Enter a ticker of any stock in the ticker field. Next, select all the parameters you want, such as the timeframe of the chart, type of display, time period,...etc. Via the 'plus button' you can then choose the indicators and overlays you are going to use. Once the graph configuration meets your needs, save it by clicking on the diskette icon. Give your chart configuration a name and click 'Save'.
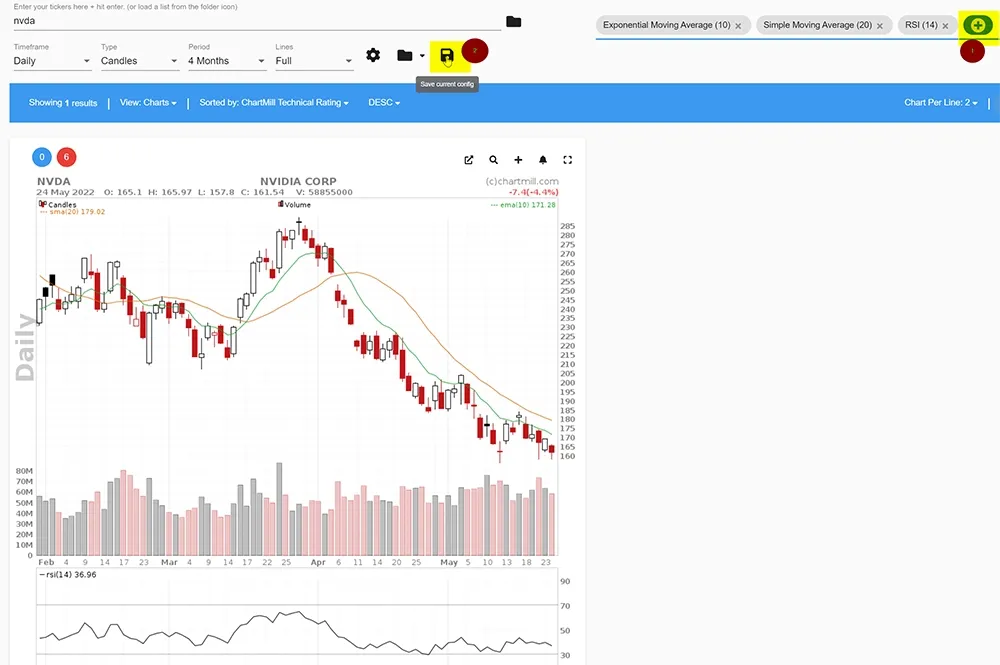
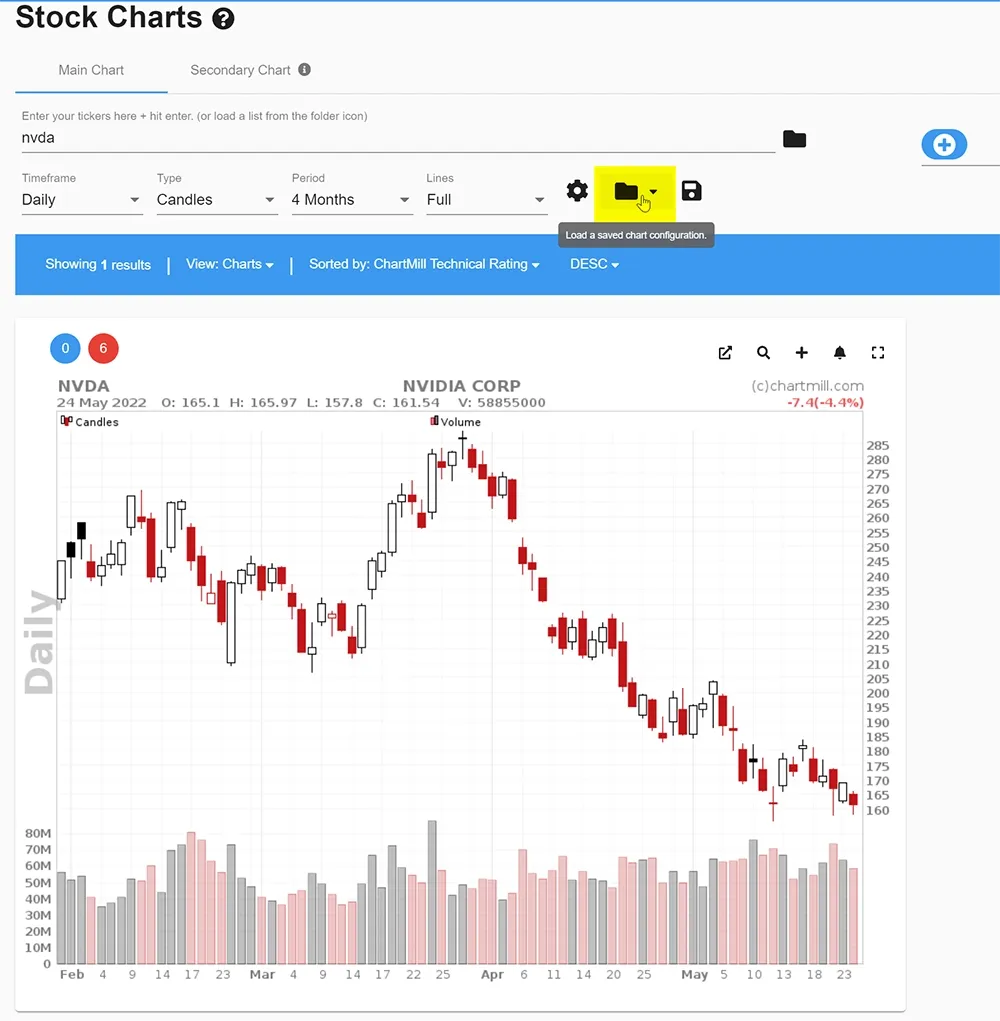
When you want to use the same chart settings for any stock, you can now easily do so with one click. Enter your ticker, press enter and then select the folder icon to retrieve the saved chart settings you want to use.
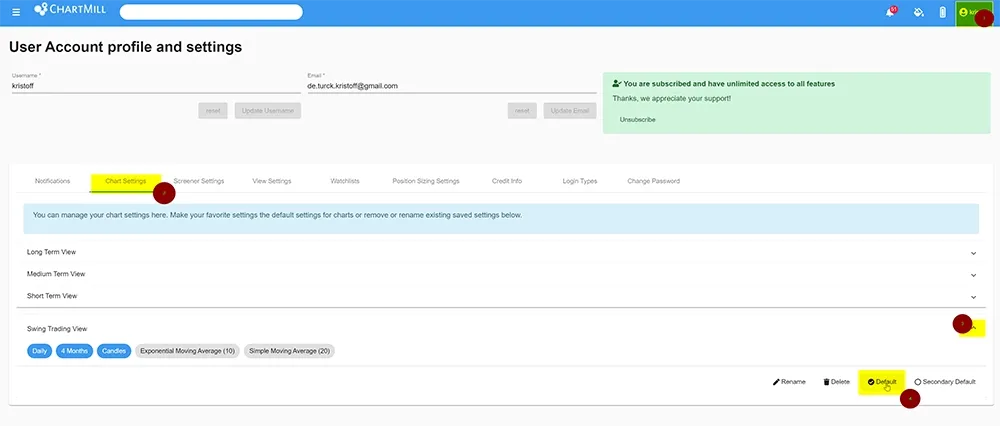
Extra Tip : Did you save several chart settings? Then you can set one of them as 'default'. Every chart you open will have these settings by default. To set this up, go to your account page by clicking on your username in the upper right corner. Next you select 'MyAccount'. In the menu bar click on Chart Settings. Here you will find all your saved chart configurations. Click on the inverted triangle of the chart configuration you want to set as default. In the menu below you now select 'default'. From now on, every chart you request will be opened with these default chart settings.
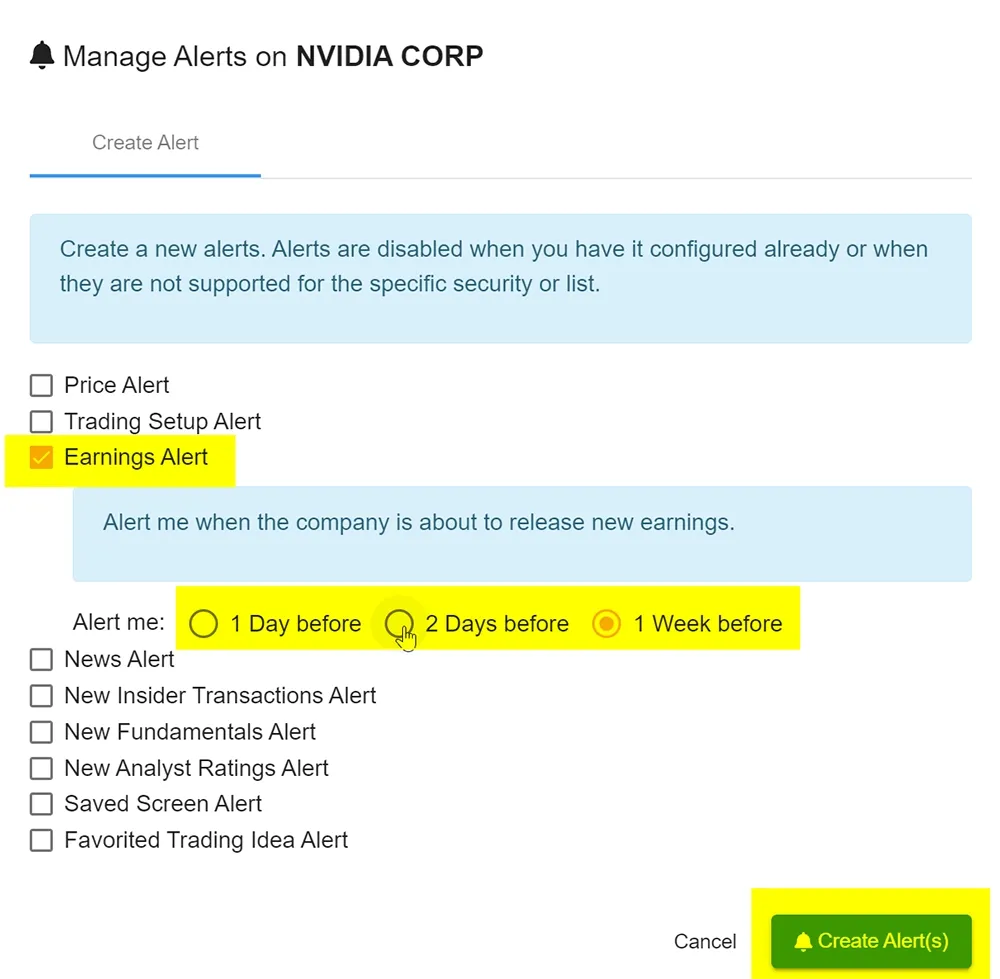
Adding an earnings alert to a specific stock
The announcement of quarterly results is important for investors and traders. It often has a major impact on the price formation. The share becomes a lot more volatile in anticipation of these results and after the announcement there are sometimes large price movements. Especially when these results are a lot better or worse than what analysts had expected, the effect on price formation can be enormous.
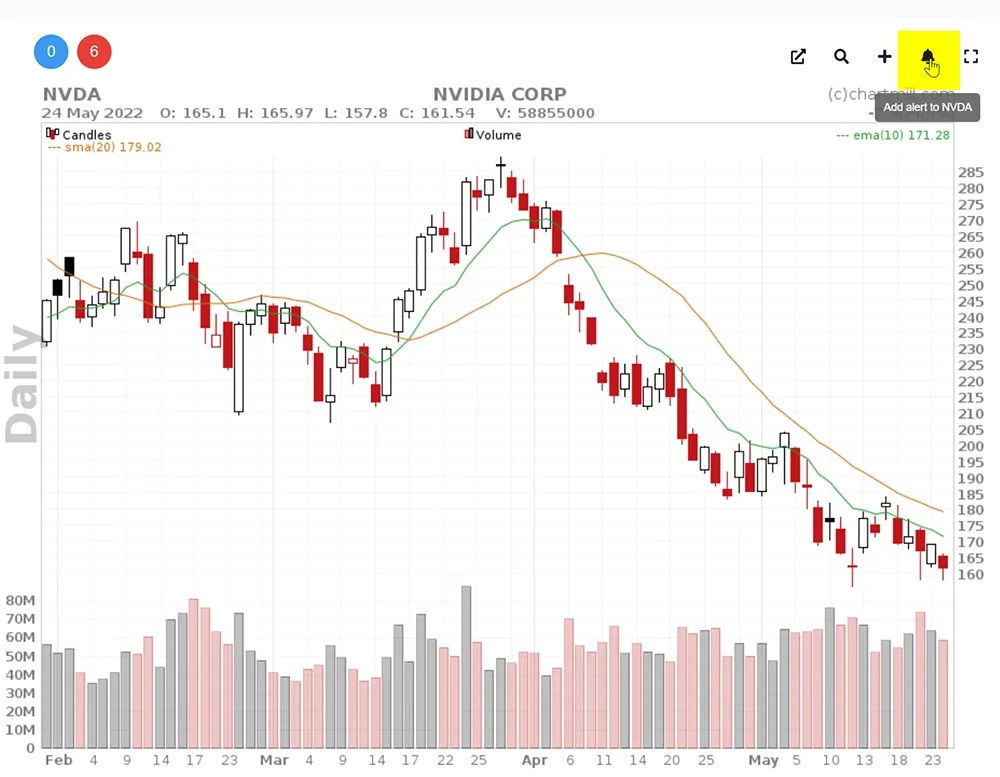
In ChartMill there is a handy function that allows you to set an alarm that will warn you if quarterly results are published in the near future. In the chart, click on the bell icon in the upper left. A selection menu will open. Click on 'earnings alert'. In the next screen you can set when you want to receive the alert, 1, 2 days or 1 week in advance. Check the other possible alerts you can set for your shares. The available settings depend on the market where the stock is listed. If the alert is not available for the ticker, it is coloured light grey.
The ChartMill Team
![]()
![]()
![]()
![]()