
Market Monitor Trends and Breadth May 12
By Kristoff De Turck - reviewed by Aldwin Keppens
Last update: May 13, 2025

(All data & visualisations by ChartMill.com)
Daily Market Trend Analysis – May 12, 2025 (After Market Close)
Short Term Trend
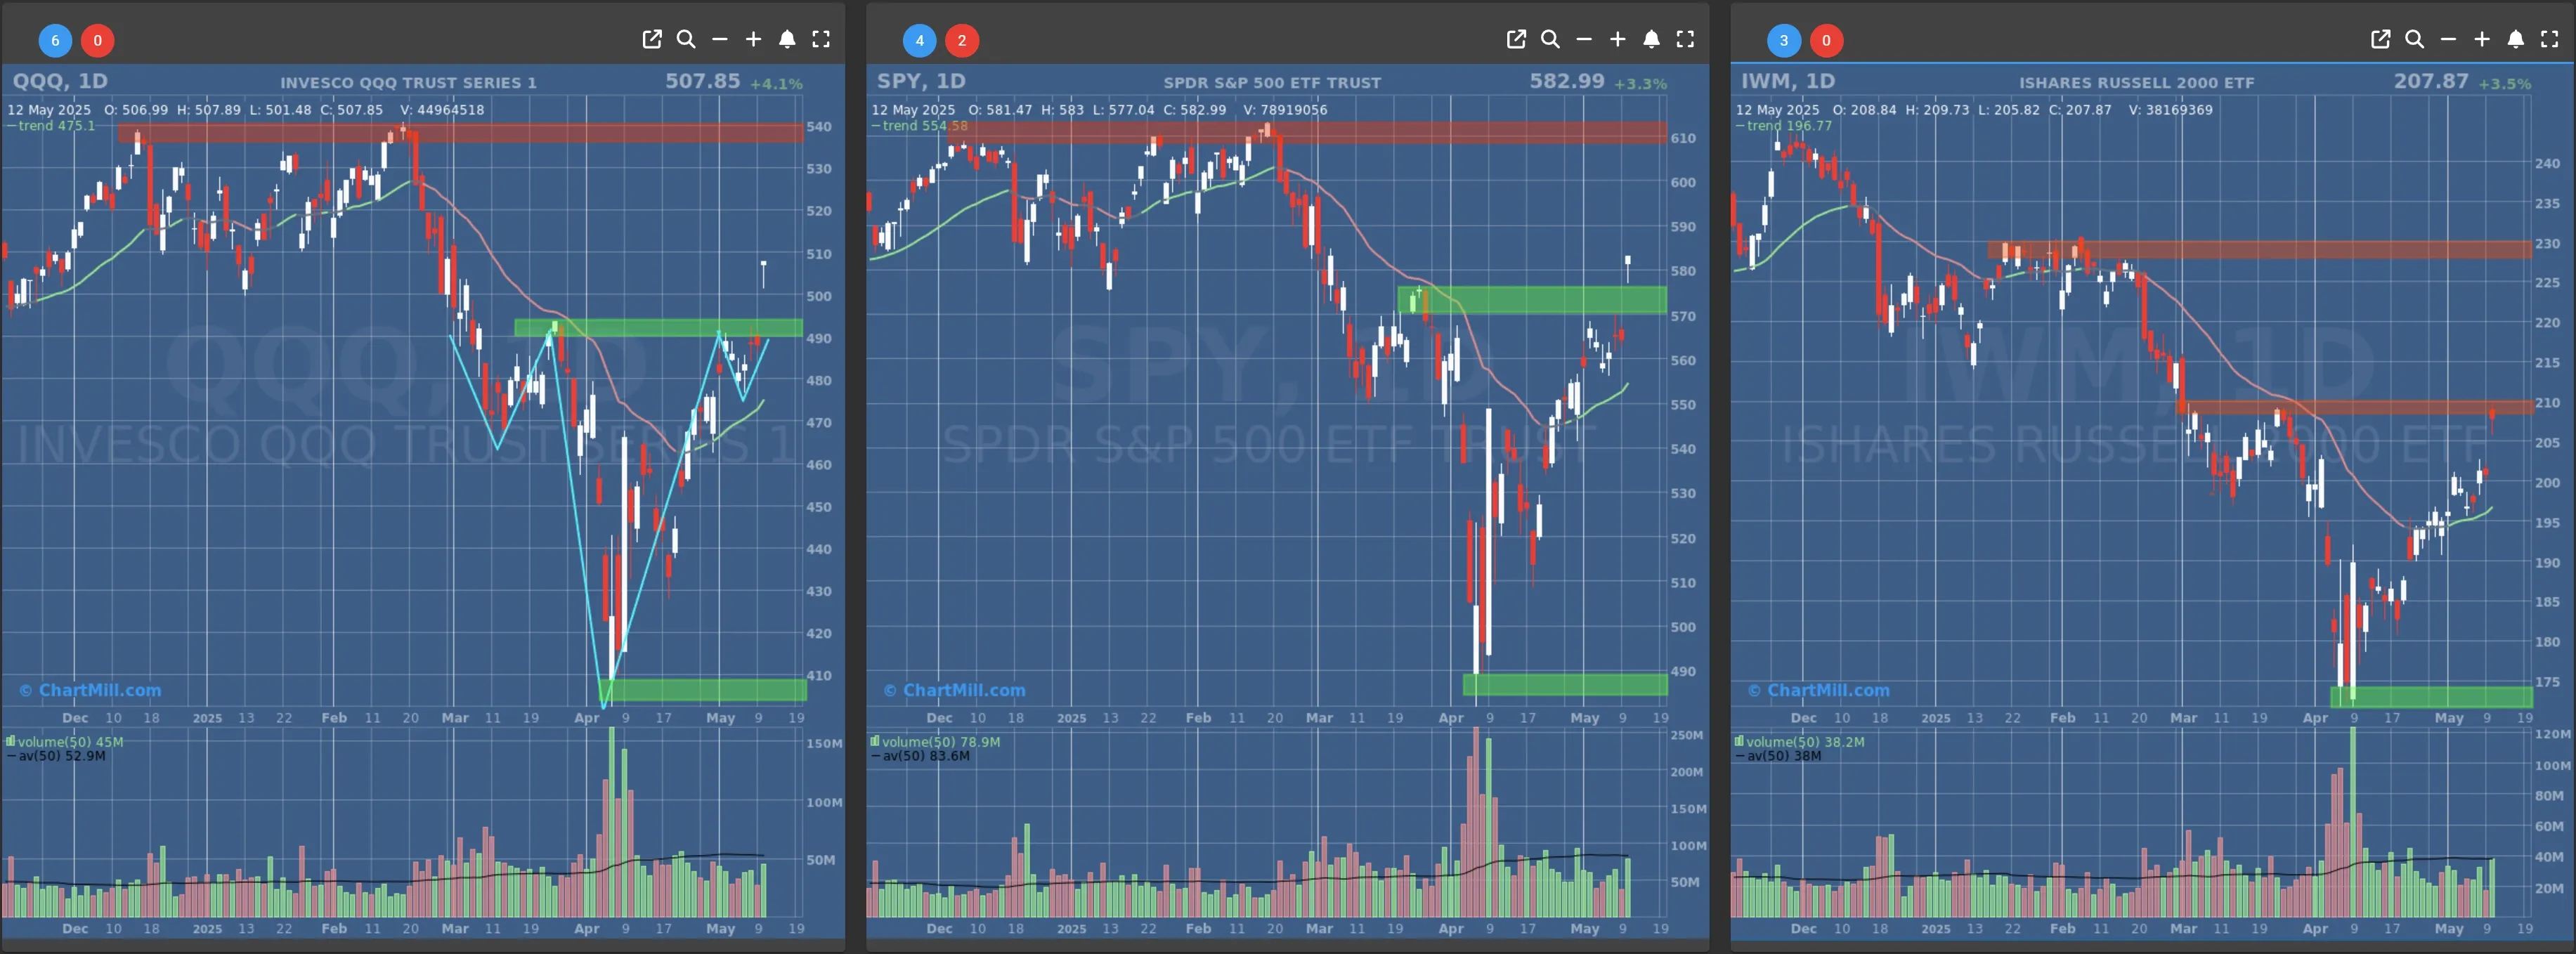
- Short-Term Trend: Bullish (no change)
- Support at $560 - $570
- Resistance at $610
- Volume: At average (50)
- Pattern: Gap Up - Hanging Man Pattern
- Short-Term Trend: Bullish (no change)
- Support at $490 - $500
- Resistance at $540
- Volume: At average (50)
- Pattern: Gap Up - Hanging Man Pattern
- Short-Term Trend: Bullish (no change)
- Support at $200
- Resistance at $210-215
- Volume: At average (50)
- Pattern: Gap Up - Hanging Man Pattern
Long Term Trend
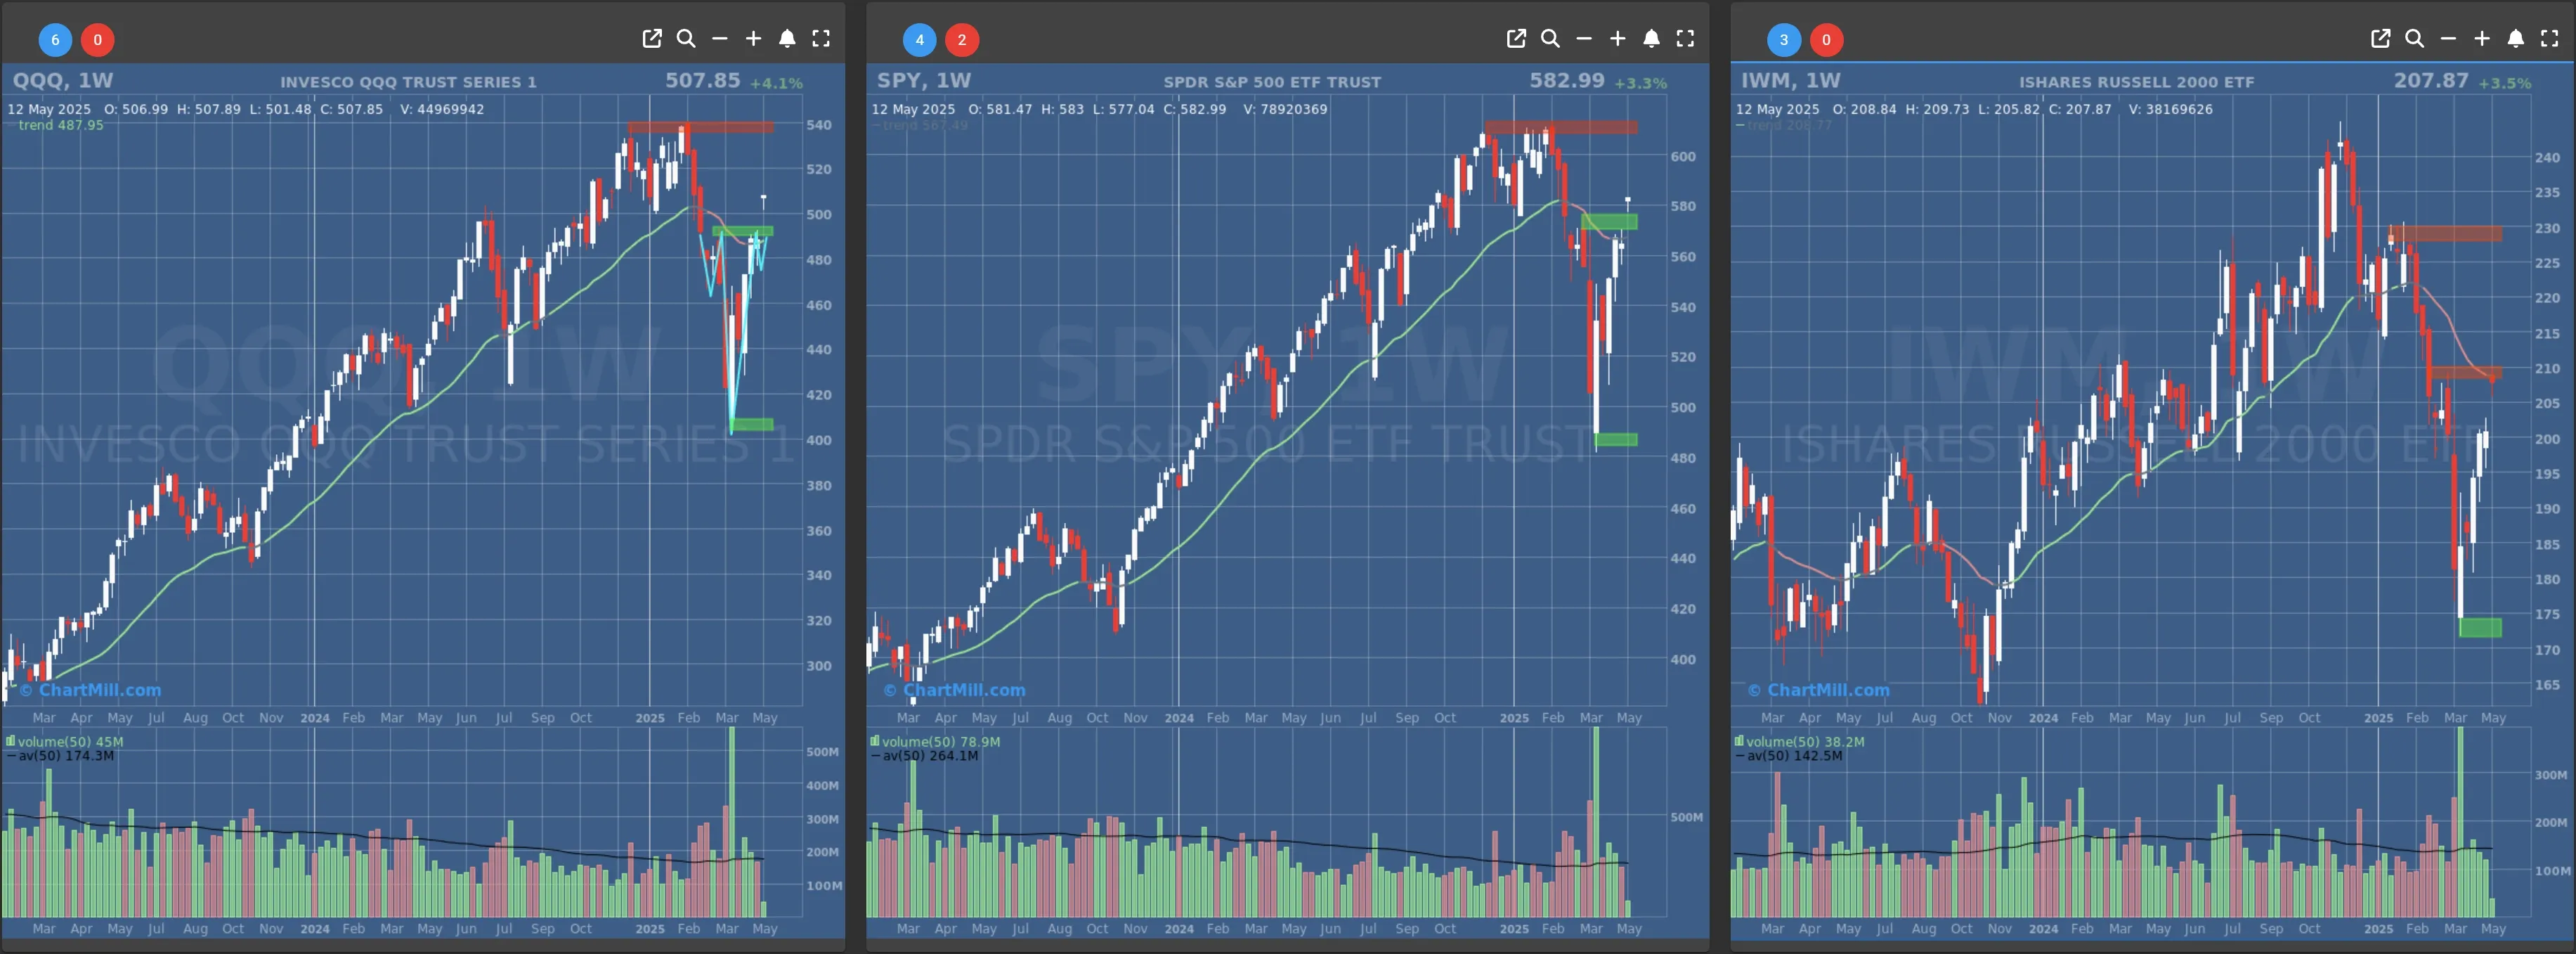
- Long-Term Trend: Neutral (no change)
- Long-Term Trend: Positive (from Neutral)
- Long-Term Trend: Neutral (from Negative)
Daily Market Breadth Analysis – May 12, 2025 (After Market Close)
The latest market breadth data shows a strong bullish sentiment, marking a notable recovery compared to recent sessions. The strength of this positive shift is significant and suggests improved investor confidence and broad participation across the market.
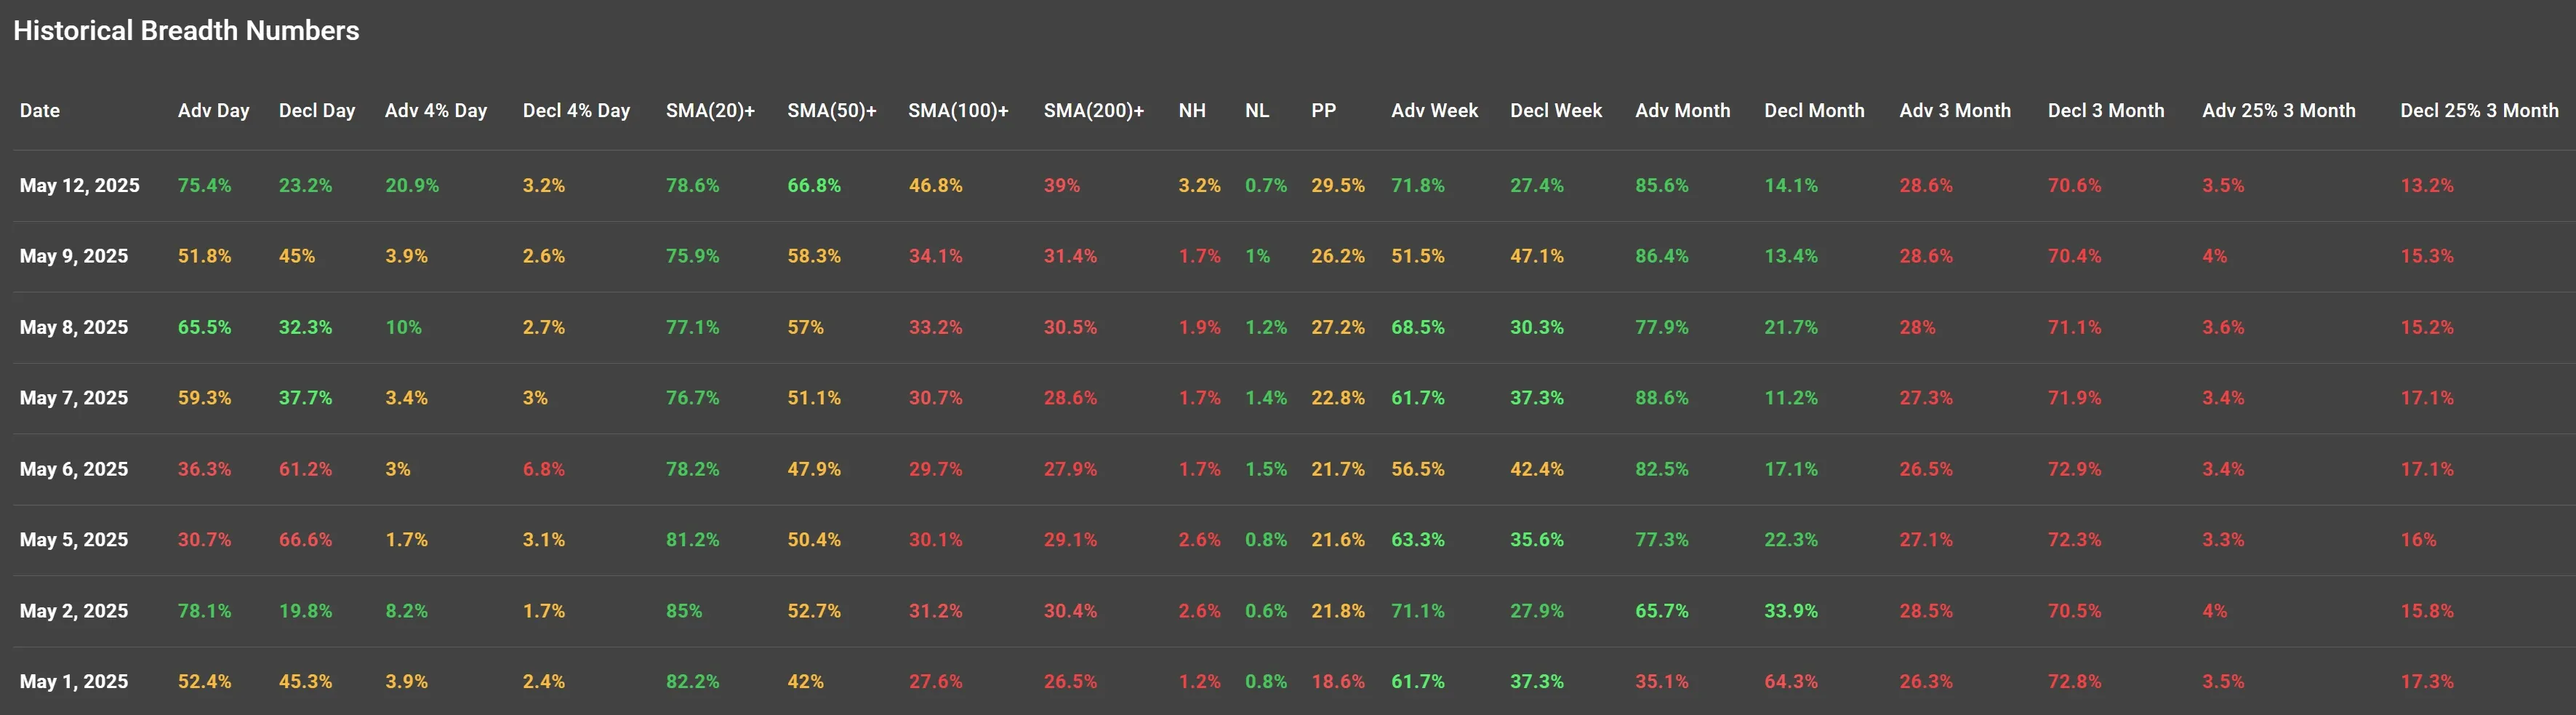
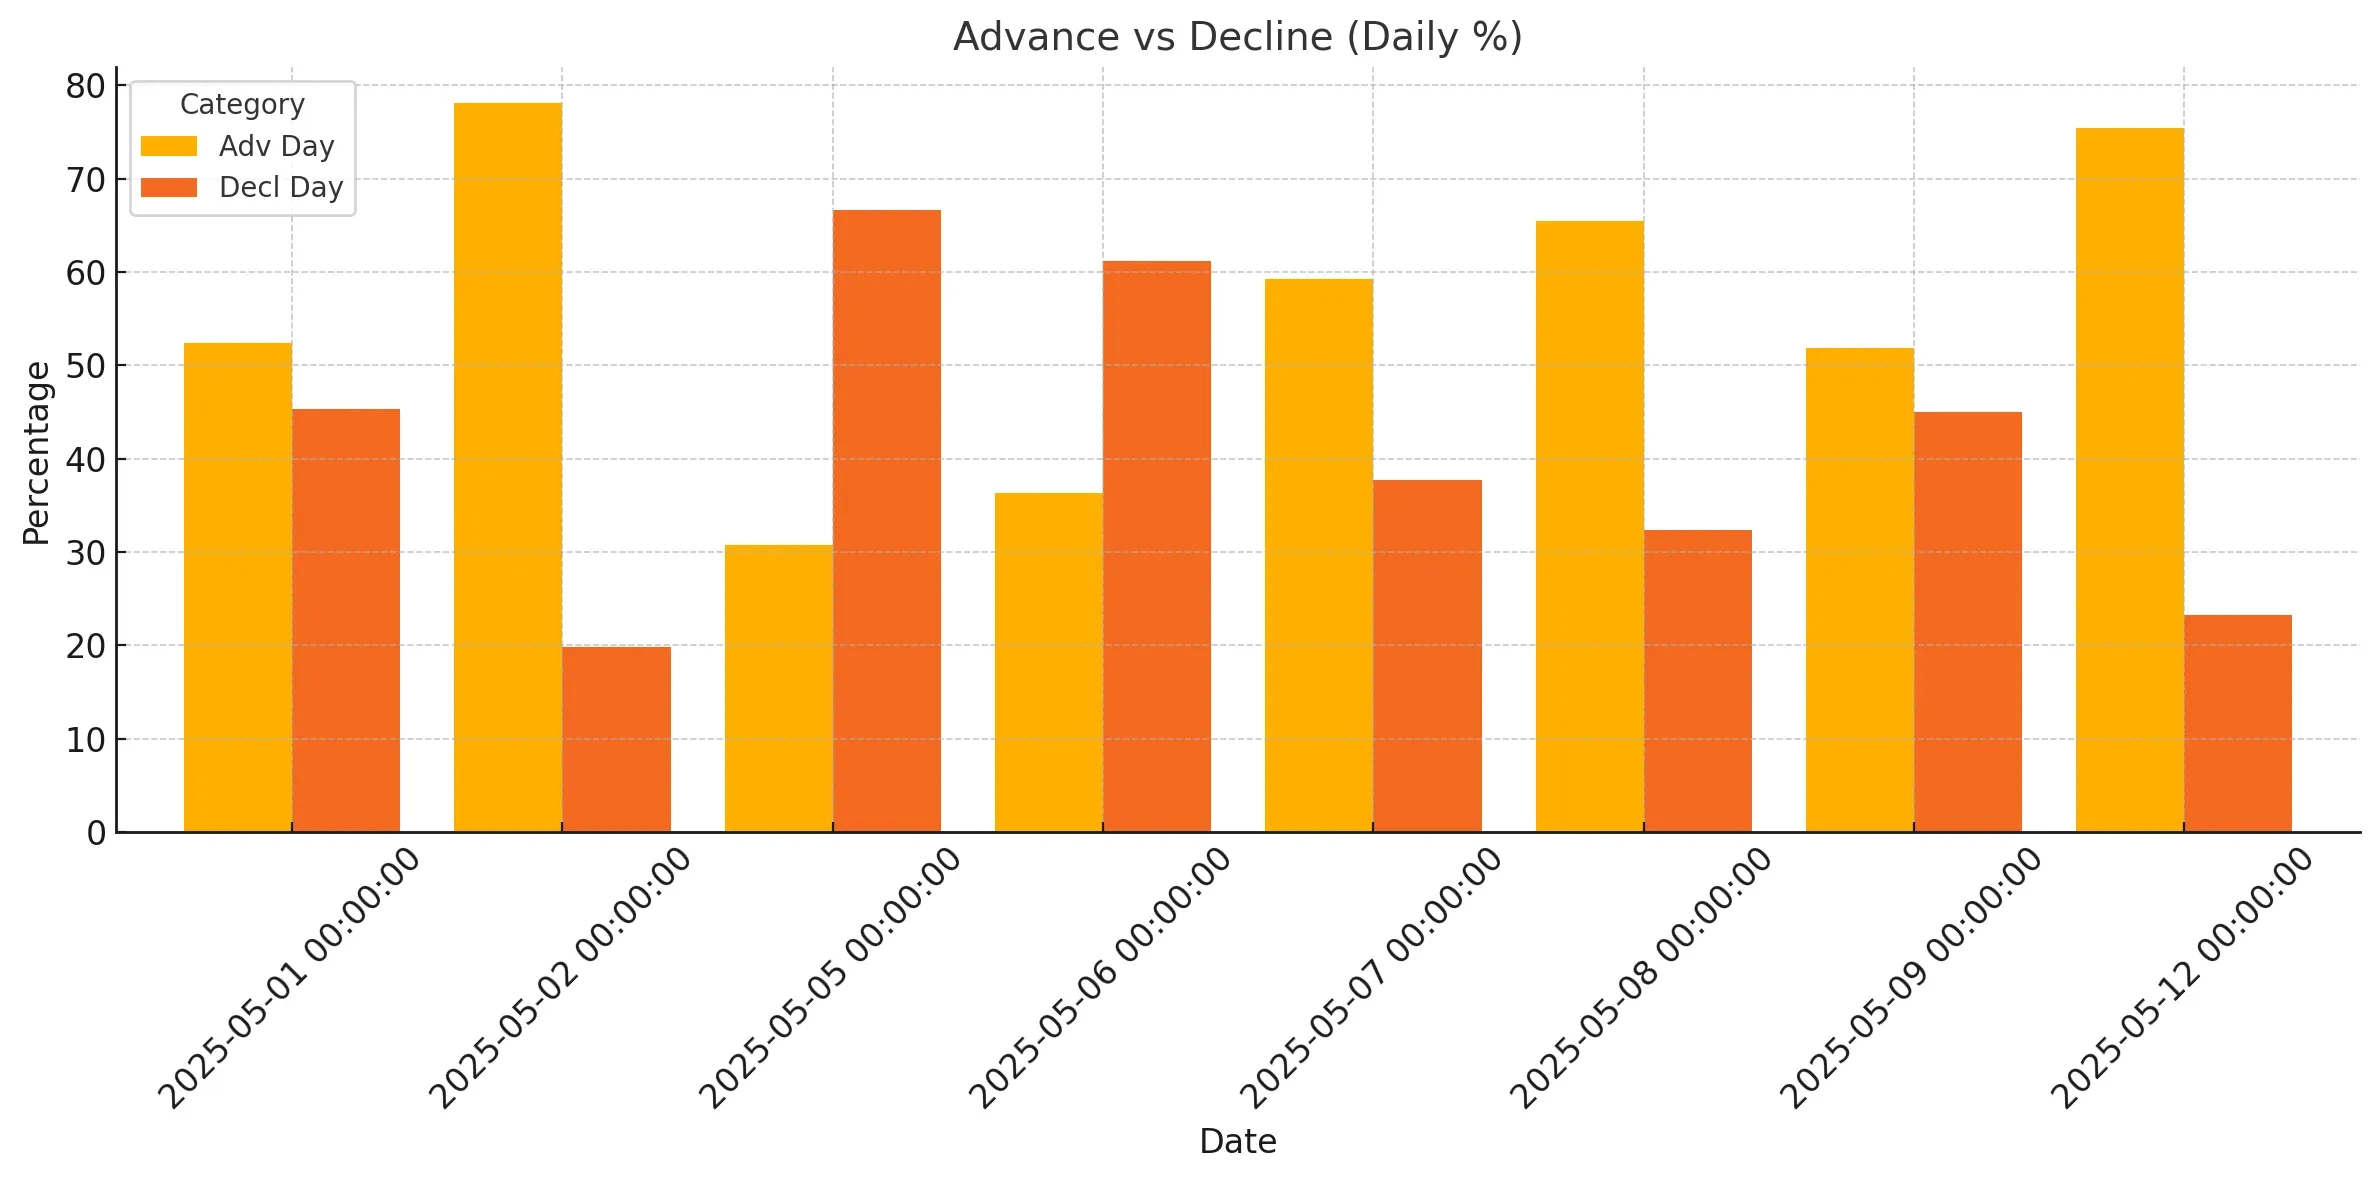
Advance vs. Decline:
On May 12, advancing issues significantly outnumbered declining issues, with 75.4% of stocks advancing compared to 23.2% declining. This indicates robust bullish market participation.
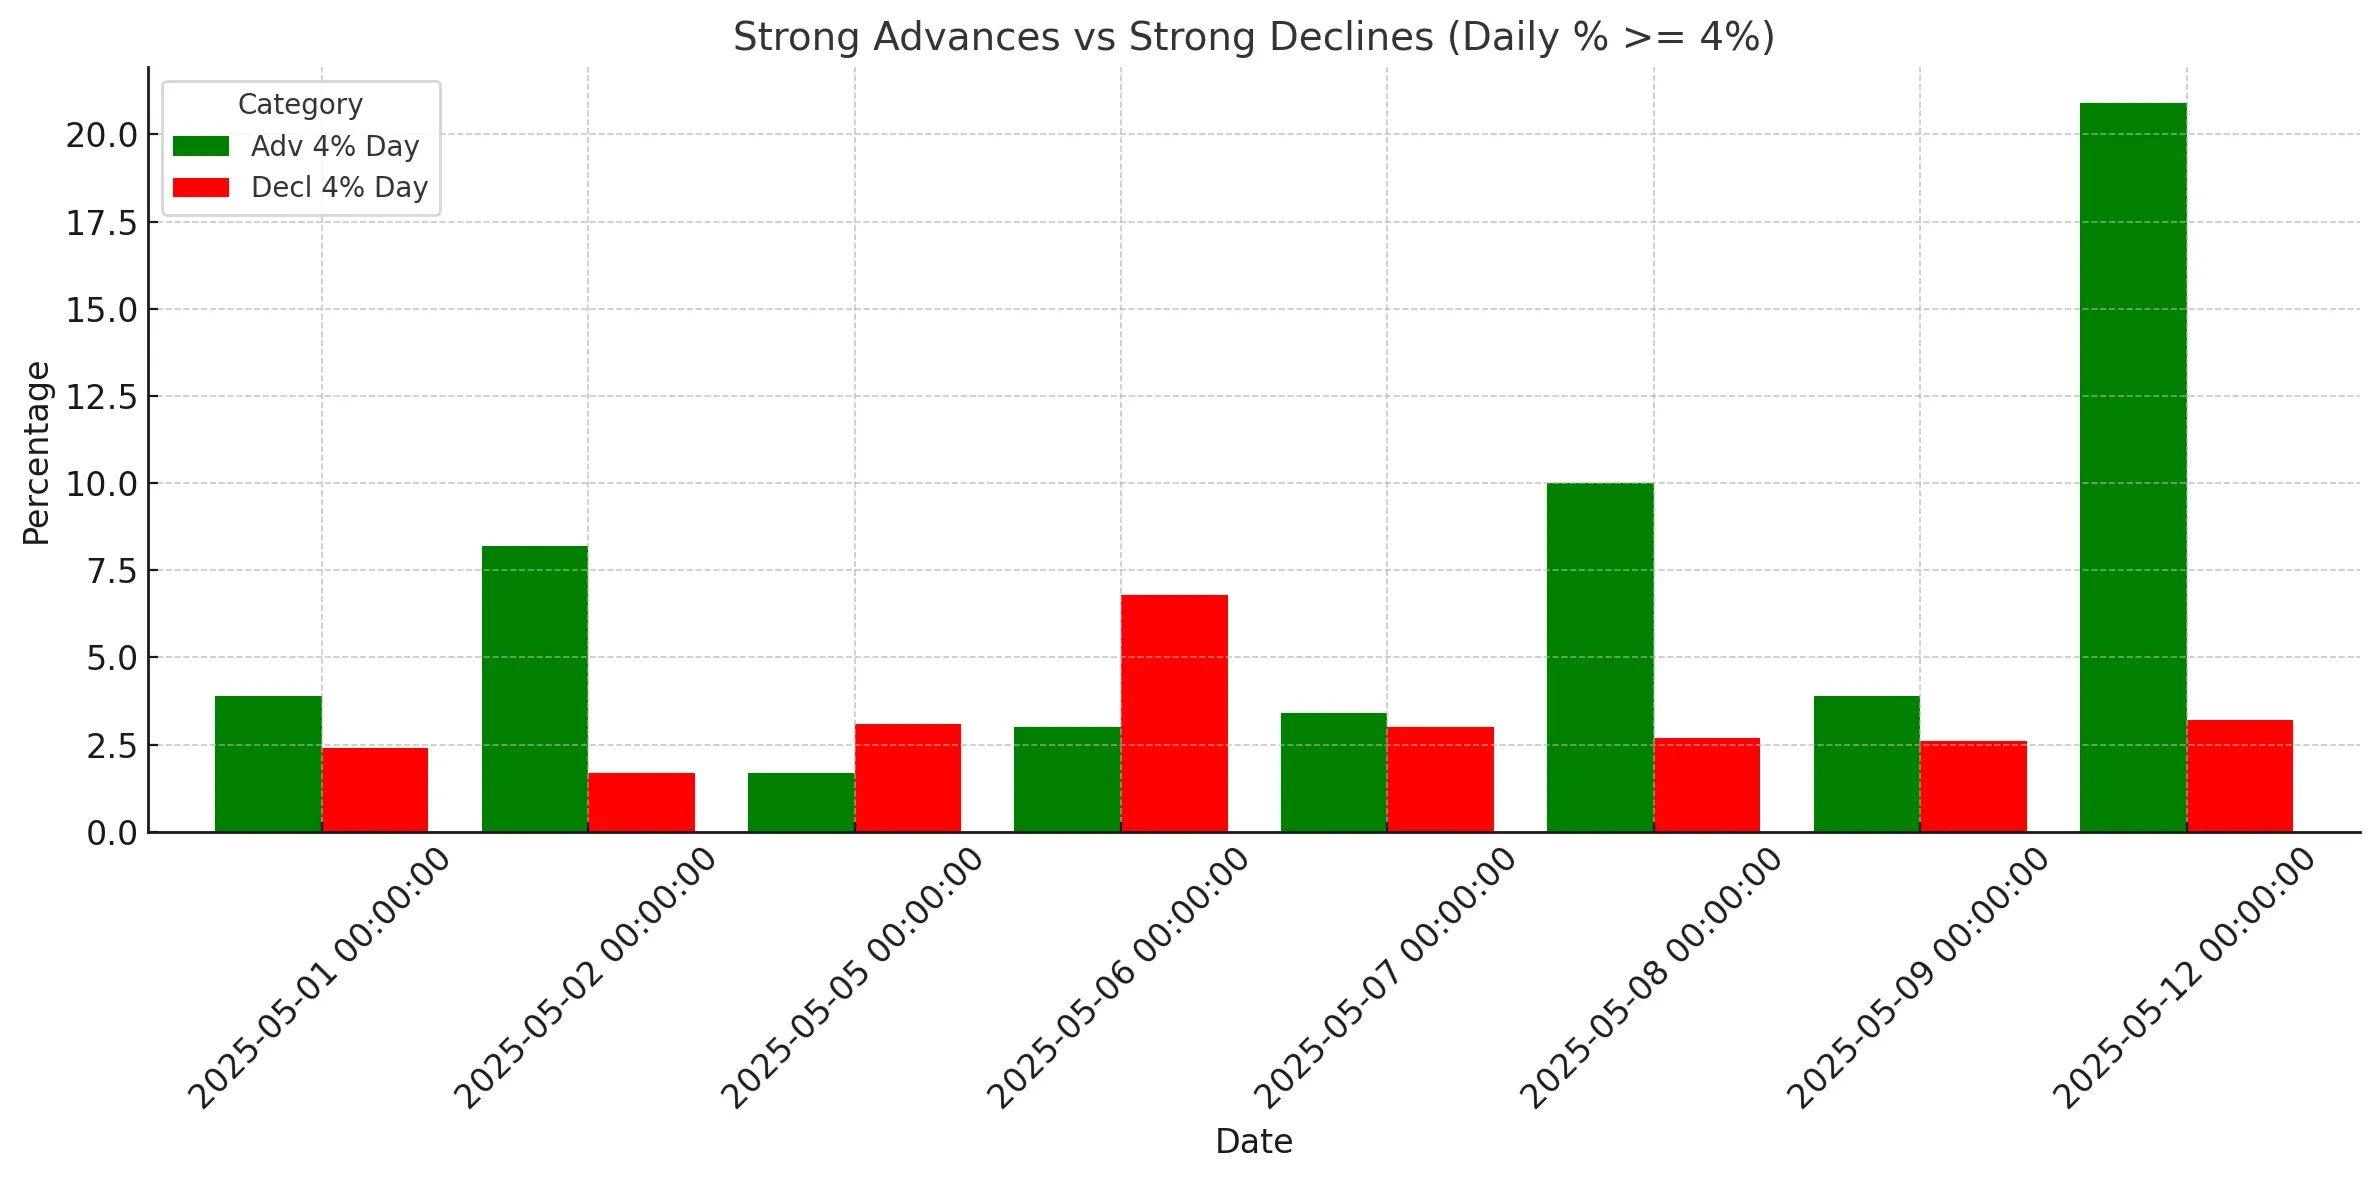
Strong Advances vs. Declines (4%+):
A notable 20.9% of stocks surged by at least 4%, against just 3.2% of stocks dropping similarly. This highlights aggressive buying activity, potentially signaling strong momentum.
Moving Average Indicators:
-
Stocks above SMA(20): At 78.6%, the majority of stocks are trading above their 20-day moving average, reinforcing short-term bullishness.
-
Stocks above SMA(50): Standing at 66.8%, indicating solid medium-term bullish momentum.
-
Stocks above SMA(100) and SMA(200): At 46.8% and 39%, respectively, these longer-term averages still show less strength but are beginning to recover, suggesting improving long-term sentiment, though still cautious.
New Highs vs. New Lows
New highs (3.2%) significantly outpaced new lows (0.7%), emphasizing renewed bullish conviction and strength across various sectors.
Weekly and Monthly Breadth
Weekly advancing stocks are at 71.8%, clearly outweighing declines (27.4%), highlighting bullish momentum at a weekly level.
Monthly breadth is also robust with 85.6% of stocks advancing, suggesting sustained investor confidence.
Longer-Term Trends
Over the past three months, declines still dominate, with 70.6% of stocks down, indicating persistent bearish sentiment in a broader context. However, recent improvements suggest a potential shift towards recovery.
Conclusion
The recent market breadth data, particularly on May 12, 2025, strongly indicates a bullish reversal. Short-term indicators are notably positive, while medium to longer-term metrics are showing signs of improvement but remain relatively cautious. Investors should watch for sustained strength in market breadth to confirm longer-term bullish momentum.
This positive shift suggests that market participants are becoming increasingly confident, providing favorable conditions for potential market continuation higher, at least in the near term.
