
Futu Holdings Ltd (NASDAQ:[FUTU](https://www.chartmill.com/stock/quote/FUTU)): A CAN SLIM Candidate
By Mill Chart
Last update:
Futu Holdings Ltd (NASDAQ:FUTU) operates as a digital brokerage platform, offering trading and investment services. The company has shown strong growth metrics, making it a potential candidate for investors following the CAN SLIM methodology.
Why CAN SLIM Investors Should Consider FUTU
The CAN SLIM strategy focuses on high-growth stocks with strong earnings momentum, institutional interest, and favorable technical setups. Here’s how Futu Holdings aligns with these criteria:
C – Current Earnings & Sales Growth
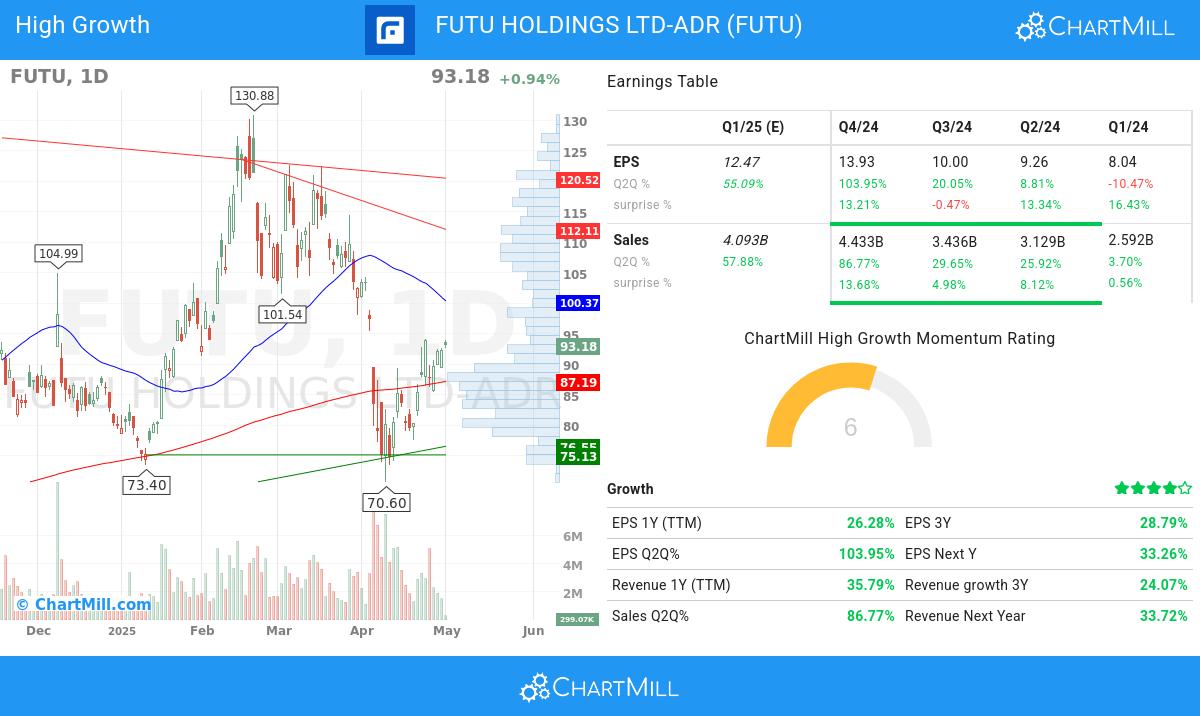
FUTU reported a 103.95% year-over-year EPS growth and 86.77% revenue growth in the latest quarter. These figures far exceed the CAN SLIM minimum requirement of 20-25% growth, indicating strong business momentum.
A – Annual Earnings Growth
The company’s three-year EPS growth stands at 28.79%, comfortably above the 25% threshold. Additionally, its Return on Equity (ROE) of 19.43% reflects efficient capital usage, another positive signal for growth investors.
N – New Highs & Innovation
FUTU operates in the fintech sector, a rapidly evolving industry. While its stock is not currently at new highs, its relative strength of 87.06 suggests it outperforms most peers in the Capital Markets industry.
S – Supply & Demand
With a debt-to-equity ratio of 0.30, FUTU maintains a healthy balance sheet. The stock also sees strong liquidity, averaging 3.25 million shares traded daily, ensuring smooth entry and exit points.
L – Market Leadership
FUTU ranks in the top 13% of stocks based on relative strength, reinforcing its position as a market leader.
I – Institutional Sponsorship
Institutional ownership sits at 38.67%, below the 85% threshold, suggesting room for further institutional accumulation.
M – Market Direction
The broader market trend remains neutral in the short term, so investors should monitor overall conditions before committing capital.
Technical & Fundamental Summary
Technical Analysis
FUTU’s technical rating is 3/10, reflecting mixed signals. While it has outperformed 87% of stocks over the past year, recent price action has been volatile. Key support levels are near $75-$80, while resistance sits around $93-$94.
View the full technical report here.
Fundamental Analysis
FUTU scores 6/10 on fundamentals, with strong profitability and growth but some concerns about financial health. Its valuation appears reasonable, with a forward P/E of 13.15, below the S&P 500 average.
View the full fundamental report here.
Conclusion
FUTU meets several key CAN SLIM criteria, particularly in earnings growth, relative strength, and institutional interest. However, investors should assess market conditions and technical setups before making decisions.
