
Groth investors are looking for stocks showing high revenue and EPS growth. We will have a look here to see if WORKDAY INC-CLASS A (NASDAQ:WDAY) is suited for growth investing, while it is forming a base and may be ready to breakout. Investors should of course do their own research, but we spotted WORKDAY INC-CLASS A showing up in our growth with base formation screen, so it may be worth spending some more time on it.
Assessing Growth for NASDAQ:WDAY
A key component of ChartMill's stock assessment is the Growth Rating, which spans from 0 to 10. This rating evaluates diverse growth factors, such as EPS and revenue growth, considering both past performance and future projections. NASDAQ:WDAY has received a 8 out of 10:
- WDAY shows a strong growth in Earnings Per Share. In the last year, the EPS has been growing by 32.13%, which is quite impressive.
- The Earnings Per Share has been growing by 33.84% on average over the past years. This is a very strong growth
- The Revenue has grown by 16.81% in the past year. This is quite good.
- Measured over the past years, WDAY shows a very strong growth in Revenue. The Revenue has been growing by 20.80% on average per year.
- The Earnings Per Share is expected to grow by 16.57% on average over the next years. This is quite good.
- The Revenue is expected to grow by 14.41% on average over the next years. This is quite good.
Looking at the Health
To gauge a stock's financial health, ChartMill utilizes a Health Rating on a scale of 0 to 10. This comprehensive evaluation encompasses liquidity and solvency, both in absolute terms and in comparison to industry peers. NASDAQ:WDAY has earned a 7 out of 10:
- An Altman-Z score of 6.25 indicates that WDAY is not in any danger for bankruptcy at the moment.
- The Altman-Z score of WDAY (6.25) is better than 68.48% of its industry peers.
- The Debt to FCF ratio of WDAY is 1.41, which is an excellent value as it means it would take WDAY, only 1.41 years of fcf income to pay off all of its debts.
- WDAY has a Debt to FCF ratio of 1.41. This is in the better half of the industry: WDAY outperforms 68.84% of its industry peers.
- WDAY has a Debt/Equity ratio of 0.35. This is a healthy value indicating a solid balance between debt and equity.
- Although WDAY does not score too well on debt/equity it has very limited outstanding debt, which is well covered by the FCF. We will not put too much weight on the debt/equity number as it may be because of low equity, which could be a consequence of a share buyback program for instance. This needs to be investigated.
- A Current Ratio of 2.05 indicates that WDAY has no problem at all paying its short term obligations.
- Looking at the Current ratio, with a value of 2.05, WDAY is in the better half of the industry, outperforming 61.23% of the companies in the same industry.
- A Quick Ratio of 2.05 indicates that WDAY has no problem at all paying its short term obligations.
- The Quick ratio of WDAY (2.05) is better than 61.96% of its industry peers.
Looking at the Profitability
Discover ChartMill's exclusive Profitability Rating, a proprietary metric that assesses stocks on a scale of 0 to 10. It takes into consideration various profitability ratios and margins, both in absolute terms and relative to industry peers. Notably, NASDAQ:WDAY has achieved a 6:
- WDAY's Return On Assets of 9.87% is amongst the best of the industry. WDAY outperforms 85.87% of its industry peers.
- With an excellent Return On Equity value of 18.79%, WDAY belongs to the best of the industry, outperforming 86.59% of the companies in the same industry.
- WDAY has a Return On Invested Capital of 2.76%. This is in the better half of the industry: WDAY outperforms 70.65% of its industry peers.
- WDAY has a Profit Margin of 19.87%. This is amongst the best in the industry. WDAY outperforms 85.87% of its industry peers.
- Looking at the Operating Margin, with a value of 5.13%, WDAY is in the better half of the industry, outperforming 72.10% of the companies in the same industry.
- WDAY's Gross Margin of 75.60% is fine compared to the rest of the industry. WDAY outperforms 68.48% of its industry peers.
Looking at the Setup
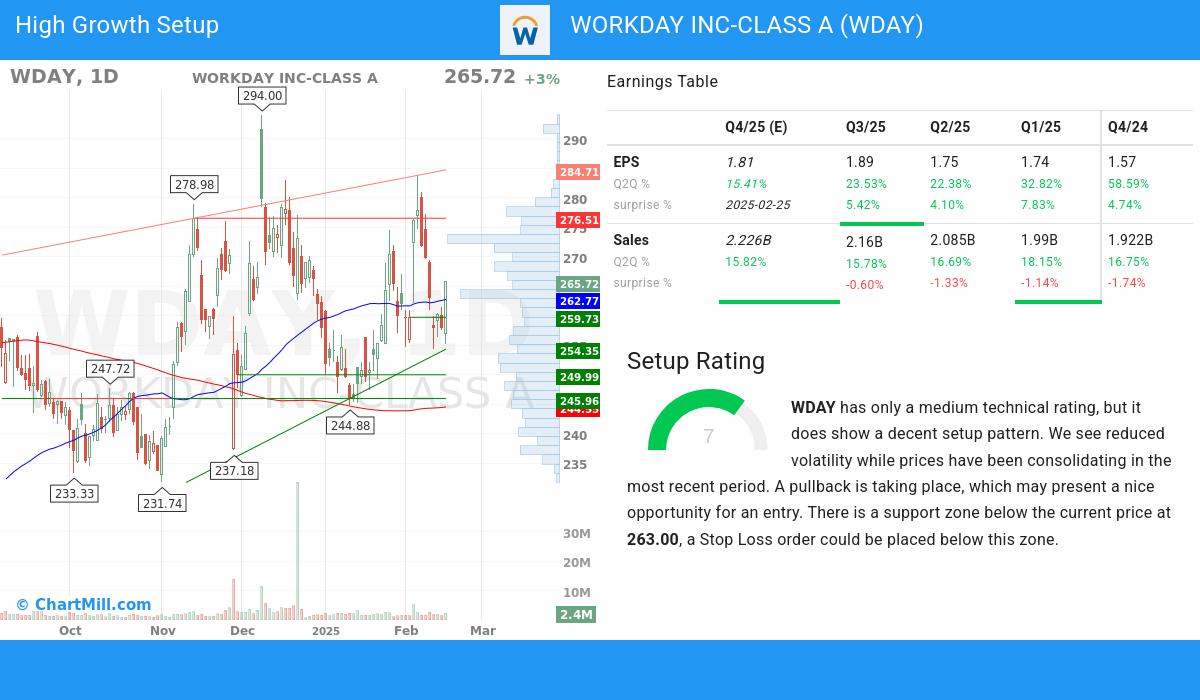
In addition to the Technical Rating, ChartMill provides a Setup Rating for each stock. This rating, ranging from 0 to 10, assesses the extent of consolidation in the stock based on multiple short-term technical indicators. Currently, NASDAQ:WDAY has a 7 as its setup rating:
Although the technical rating is only medium, WDAY does present a nice setup opportunity. We see reduced volatility while prices have been consolidating in the most recent period. A pullback is taking place, which may present a nice opportunity for an entry. There is a support zone below the current price at 263.00, a Stop Loss order could be placed below this zone.
Every day, new Strong Growth stocks can be found on ChartMill in our Strong Growth screener.
Check the latest full fundamental report of WDAY for a complete fundamental analysis.
Our latest full technical report of WDAY contains the most current technical analsysis.
Disclaimer
This article should in no way be interpreted as advice. The article is based on the observed metrics at the time of writing, but you should always make your own analysis and trade or invest at your own responsibility.